Please use a PC Browser to access Register-Tadawul
Introduction to Sahm's stock chart
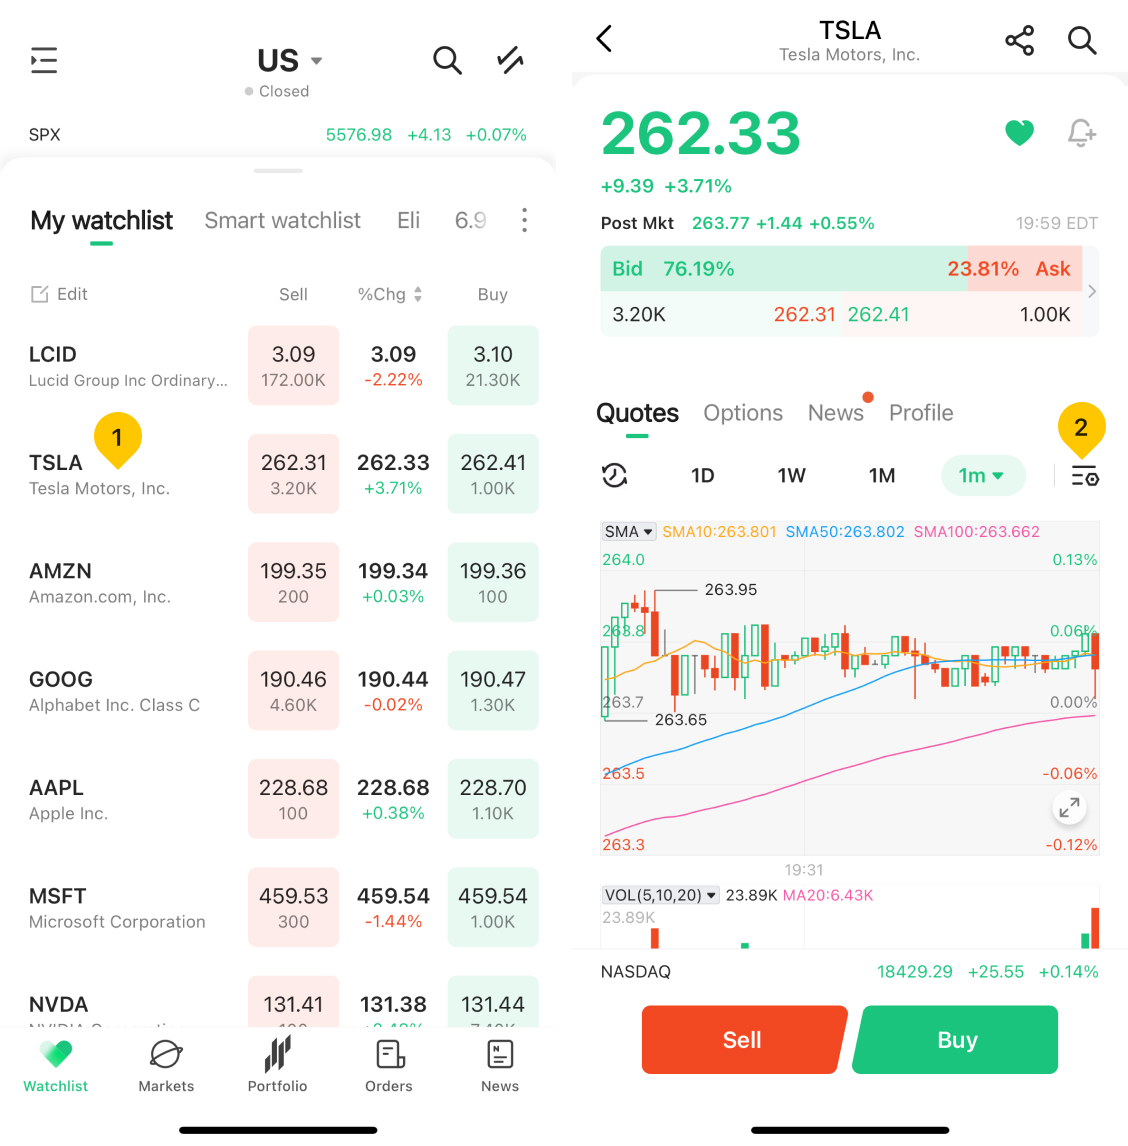
1. Navigate to the stock you're interested in by entering its detail page.
2. Within the stock detailed page, you’ll find three distinct sections of the stock chart:
- Time range. In this section, you have the flexibility to choose from various time frames that align with your trading preferences.
- Main chart. This is the primary chart displaying the stock's price movement over time.
- Sub-chart. It offers a range of technical analysis indicators for in-depth insights.
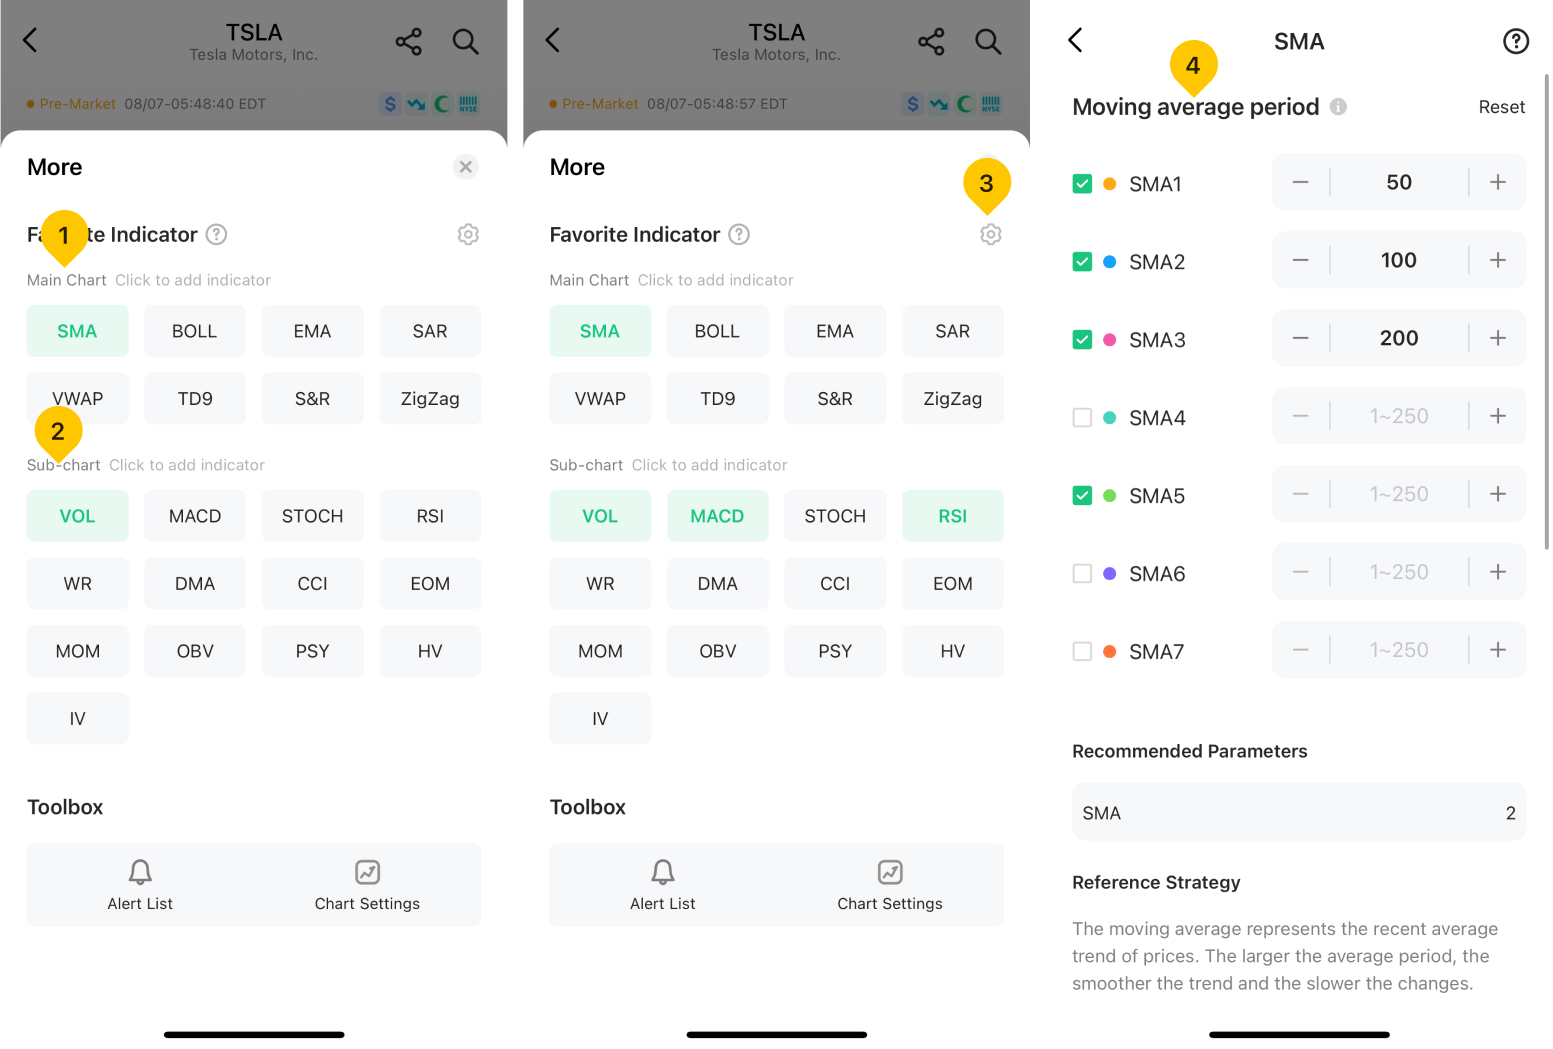
3. Tap "Settings" icon located in the upper-right corner of the chart to change chart type, favorite indicator of main chart and the sub-chart. Both line chart and hollow candle chart can be displayed by minute, 5-day, 1-month, 3-month, 1-year, 3-year and 5-year variations with the shortcuts.

4. Tap on the "Setting" icon to customize the parameters of your selected technical indicators.

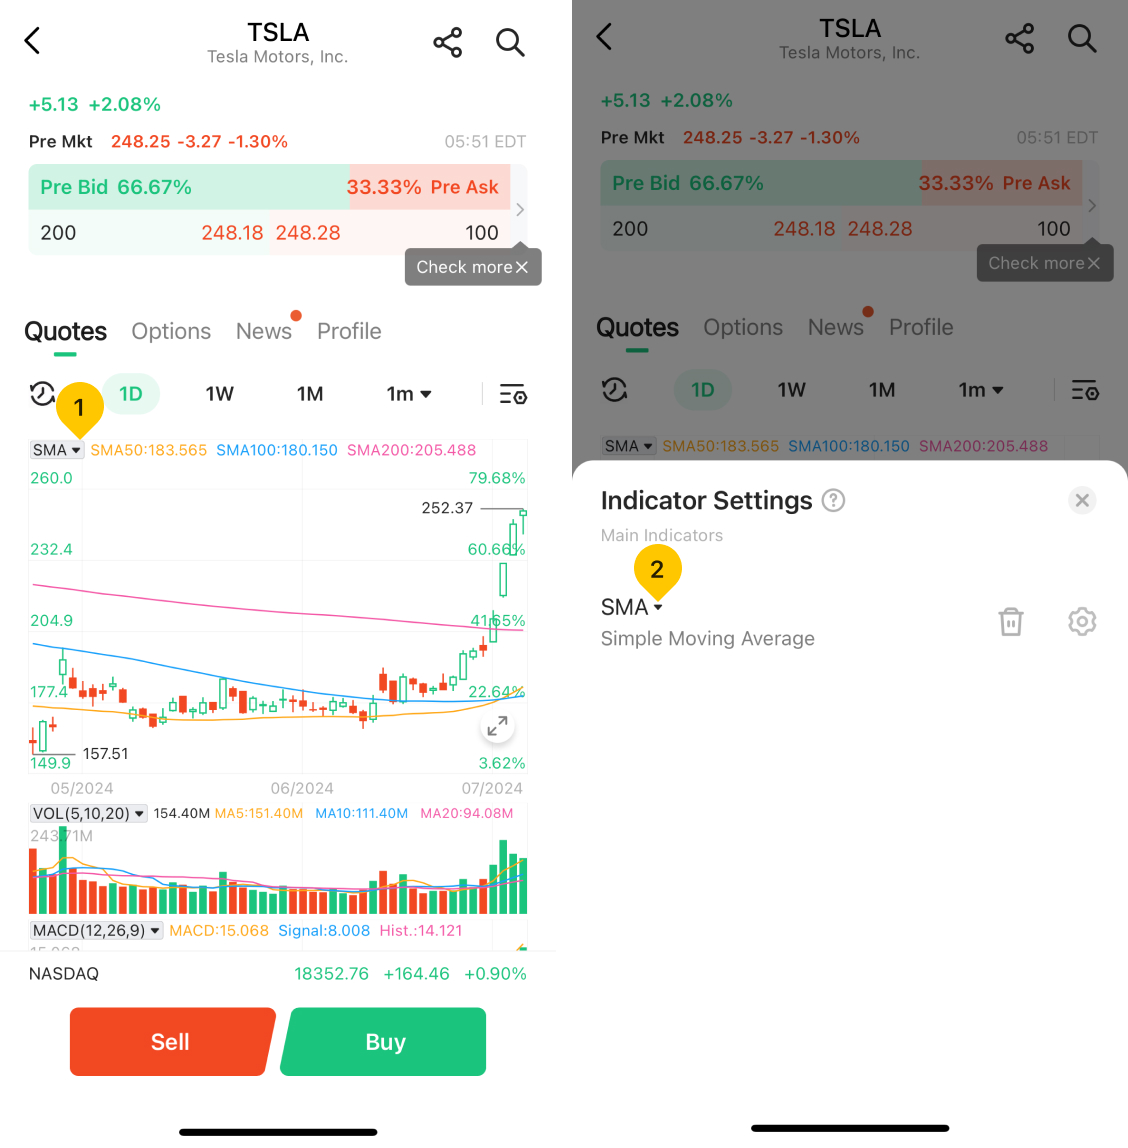
5. Once you've chosen your preferred technical indicators, you can take advantage of a convenient shortcut feature to adjust their settings with ease. Here's how:
- Tap the indicator icon located on the upper left of the main chart or sub-chart you wish to modify.
- From there, you can seamlessly switch to different indicators, configure parameters to match your preferences, and even delete the selected indicator as needed.

Was this article helpful?
You can also
contact Customer Services
for help.
Yes
No


