Users can follow the instructions below to customize technical indicators displayed in the main and sub charts:
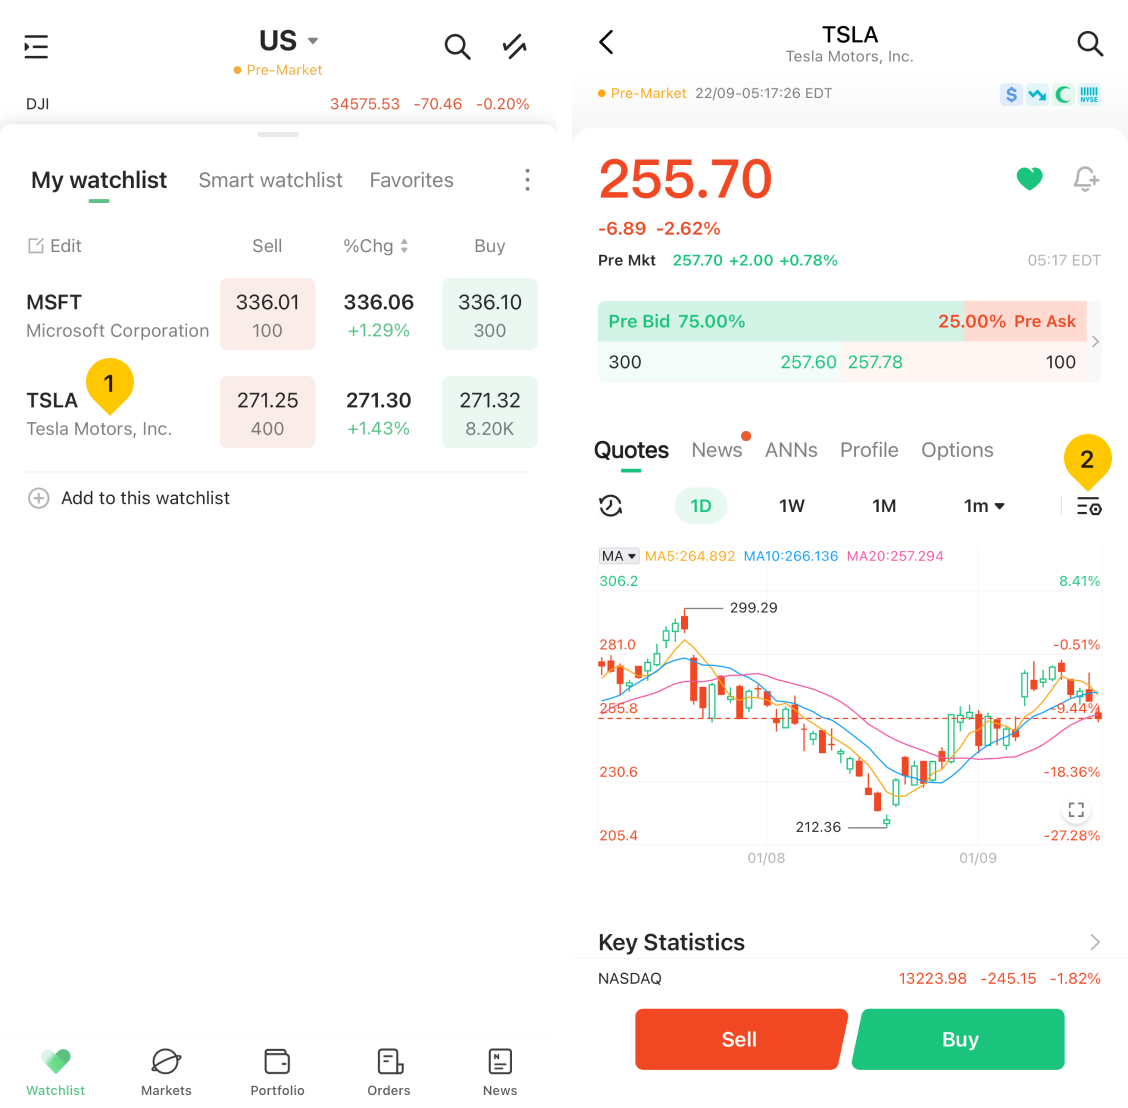
Access the detailed page of the stock you want to analyze.
Within the stock detailed page, you’ll find three distinct sections of the stock chart:
First, time range. In this section, you have the flexibility to choose from various time frames that align with your trading preferences.
Second, the main chart. This is the primary chart displaying the stock's price movement over time.
Third, the sub-chart. It offers a range of technical analysis indicators for in-depth insights.
In the stock main chart section, look for the "Settings" icon located in the upper-right corner of the chart.
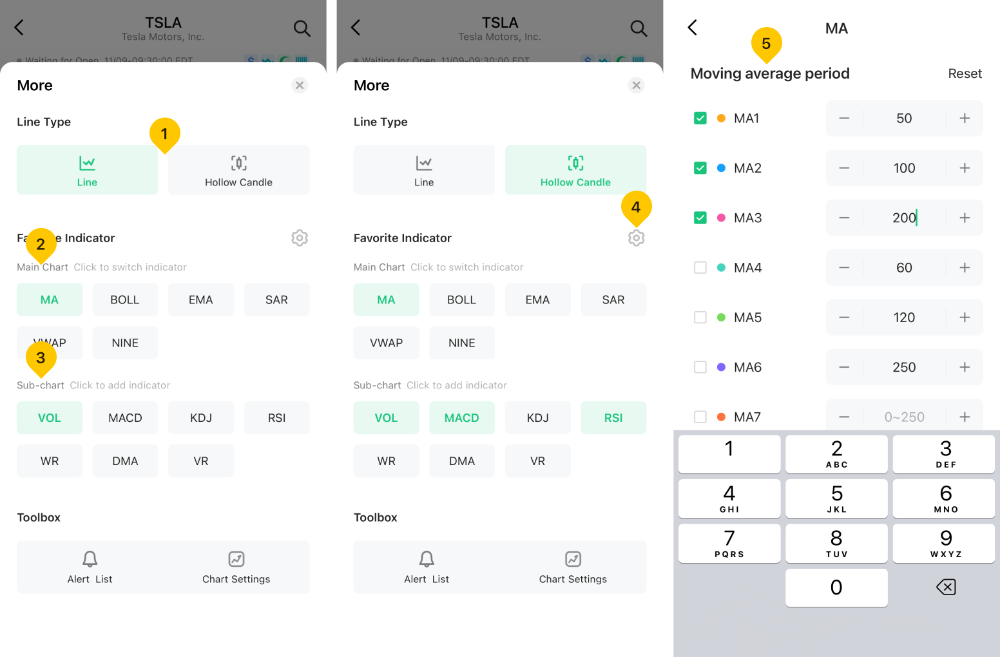
Select multiple indicators for both the main chart and the sub-chart.
Tap on the "Setting" icon to customize the parameters of your selected technical indicators. This allows you to fine-tune the indicators to align with your specific trading strategy.
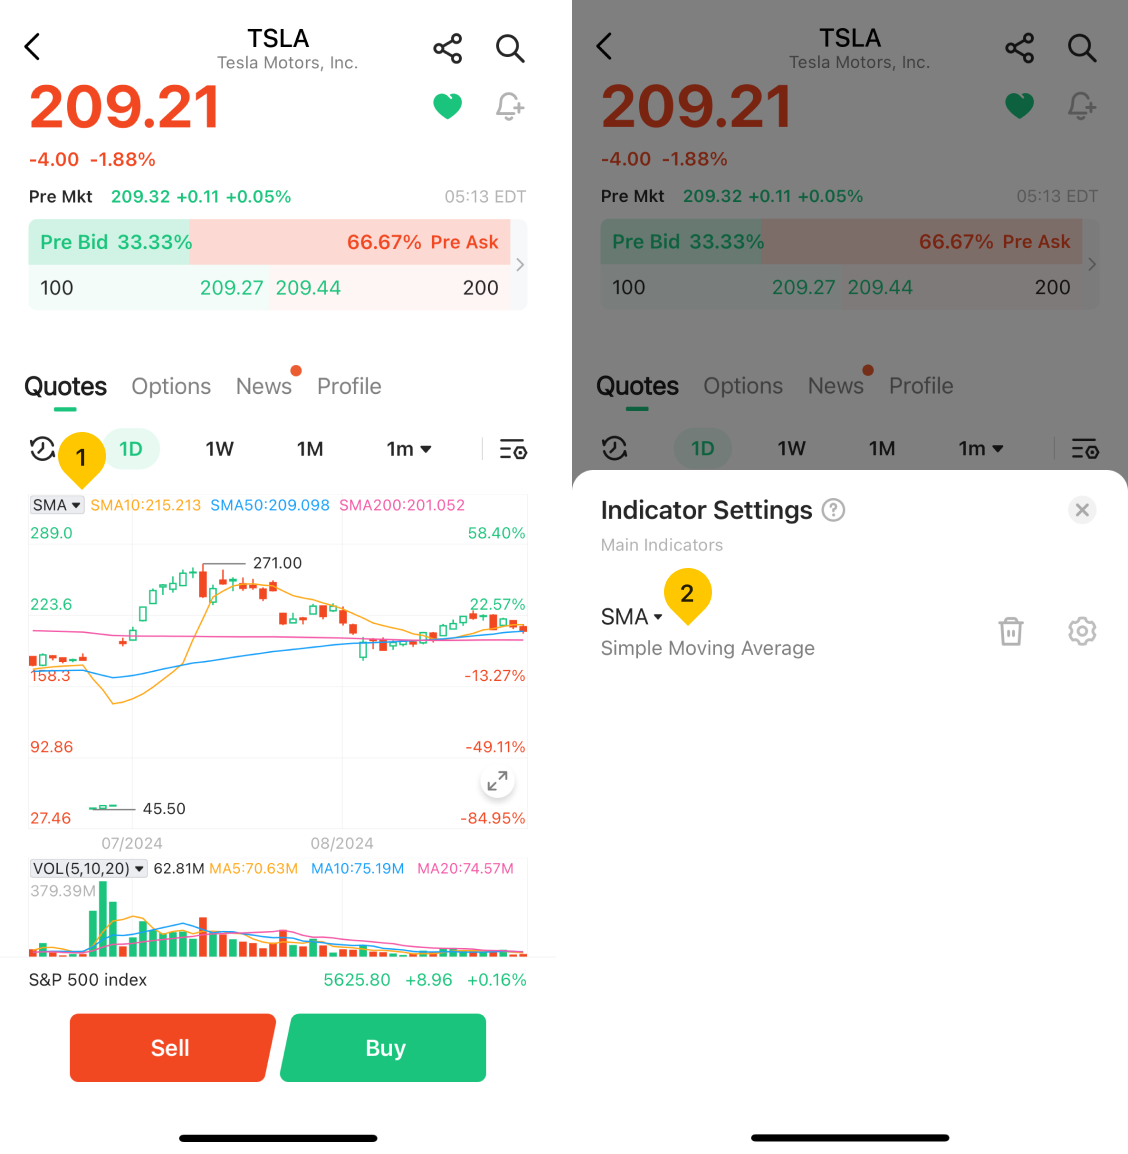
Once you've chosen your preferred technical indicators, tap the indicator icon located on the upper left of the main chart or sub-chart you wish to modify.