Will Derivative Gains and Olympus Deal Reshape EQT's (EQT) Appalachian Footprint and Long-Term Narrative?
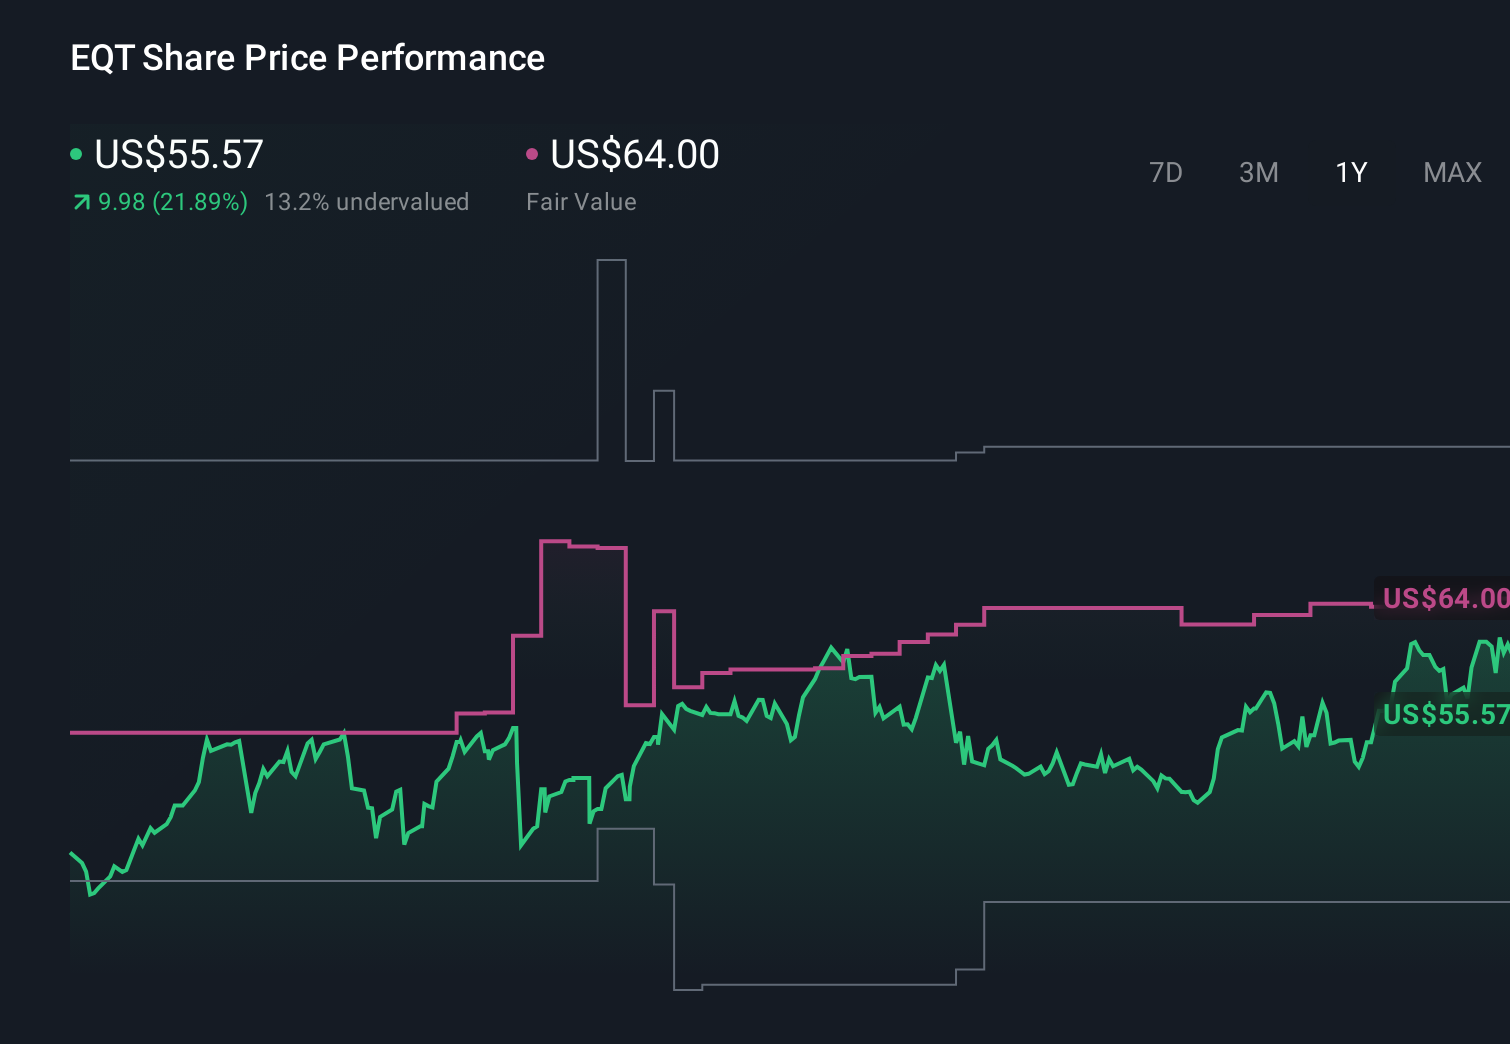
EQT Corporation EQT | 59.52 | -2.57% |
- In late January 2026, EQT Corporation, the largest U.S. natural gas producer, reported expected fourth-quarter 2025 derivative gains alongside continued expansion in the Appalachian Basin, including its recent Olympus Energy acquisition.
- These developments helped cement EQT’s rise into the sixth-largest publicly traded oil and gas producer in the United States, underscoring its growing scale and influence in North American gas markets.
- Against this backdrop, we’ll examine how EQT’s growing production footprint in the Appalachian Basin shapes its investment narrative for long-term investors.
The end of cancer? These 29 emerging AI stocks are developing tech that will allow early identification of life changing diseases like cancer and Alzheimer's.
What Is EQT's Investment Narrative?
To own EQT, you have to believe its scale in Appalachian natural gas can keep translating into resilient cash generation, even as commodity prices move around. The latest derivative gain guidance and Olympus-driven production growth mostly reinforce, rather than redefine, the near term story: key catalysts remain the upcoming Q4 2025 earnings release on February 17, any updated 2026 production and capital plans, and how efficiently EQT integrates its expanded footprint. The sharp share move alongside higher gas prices shows how tightly the stock is tethered to pricing, but the derivative gains themselves are unlikely to be a lasting driver. Instead, the bigger swing factors still look like gas price volatility, infrastructure spending needs, and the risk that recent insider selling is hinting at management’s own view of valuation.
However, one current risk investors should not overlook relates to that recent insider selling activity. Despite retreating, EQT's shares might still be trading 47% above their fair value. Discover the potential downside here.Exploring Other Perspectives
Six fair value estimates from the Simply Wall St Community span roughly US$47.87 to about US$102.43, reflecting very different expectations for EQT’s upside. Set that against the short term focus on gas price swings and execution on the Olympus integration, and it becomes clear why you may want to weigh several viewpoints before deciding how EQT fits into your portfolio.
Explore 6 other fair value estimates on EQT - why the stock might be worth 13% less than the current price!
Build Your Own EQT Narrative
Disagree with this assessment? Create your own narrative in under 3 minutes - extraordinary investment returns rarely come from following the herd.
- A great starting point for your EQT research is our analysis highlighting 3 key rewards and 1 important warning sign that could impact your investment decision.
- Our free EQT research report provides a comprehensive fundamental analysis summarized in a single visual - the Snowflake - making it easy to evaluate EQT's overall financial health at a glance.
Seeking Other Investments?
Our daily scans reveal stocks with breakout potential. Don't miss this chance:
- Rare earth metals are the new gold rush. Find out which 30 stocks are leading the charge.
- Find companies with promising cash flow potential yet trading below their fair value.
- Explore 22 top quantum computing companies leading the revolution in next-gen technology and shaping the future with breakthroughs in quantum algorithms, superconducting qubits, and cutting-edge research.
This article by Simply Wall St is general in nature. We provide commentary based on historical data and analyst forecasts only using an unbiased methodology and our articles are not intended to be financial advice. It does not constitute a recommendation to buy or sell any stock, and does not take account of your objectives, or your financial situation. We aim to bring you long-term focused analysis driven by fundamental data. Note that our analysis may not factor in the latest price-sensitive company announcements or qualitative material. Simply Wall St has no position in any stocks mentioned.