
Please use a PC Browser to access Register-Tadawul
Get It
Trading Wisdom | It's Difficult to Predict Market Bottoms and Tops, Here Are Key Tips to Spot Potential Turning Points
S&P 500 index SPX | 0.00 | |
Tadawul All Shares Index TASI.SA | 0.00 |
Accurately predicting the market's highs and lows is not an easy task, even for the most experienced traders and investors. Most of the time, predicting whether the market will rise or fall is essentially a coin toss.
Despite certain situations that may lead us to have a preference, these are not sufficient for making predictions.
Instead, the thinking should be: How can I identify potential turning points in the market? These are points that are likely to precede volatility or momentum increases compared to any random market data.
For many independent traders, they're making small, conservative trades with a slightly positive expectation until the conditions are clearly in their favour, which is when they increase their stake significantly.
Most often, these optimal conditions occur near turning points or at market highs and lows.
Breaking the Trend
Not all market highs and lows occur within a trend. However, it is generally more challenging to find consistently profitable opportunities in a trendless, fluctuating market.
Prices are mostly random, and it's difficult to define current market behavior.
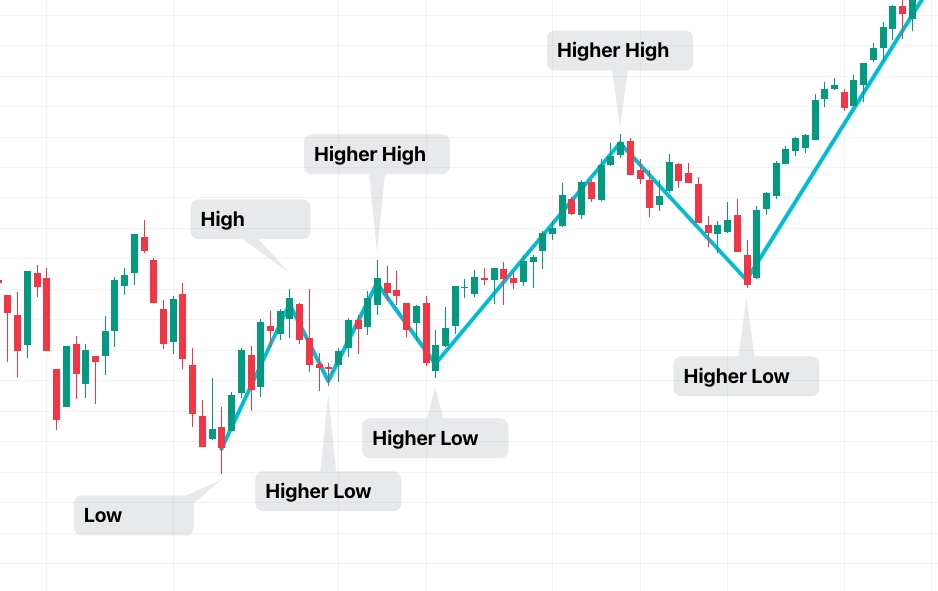
If we assume we are only looking for the possibility of a top or a bottom, the first step is to identify the current trend's turning points.
Every trader has their definition of a trend. Some use indicators, trend lines, growth rates, etc. The basic way to differentiate between a trend and a non-trend is a series of higher highs and lower lows (or vice versa).
This is the fundamental pattern. Everything else depends on personal preference.
Below is a clear case of a trend break. A higher low has been broken, suggesting a potential change in the trend.
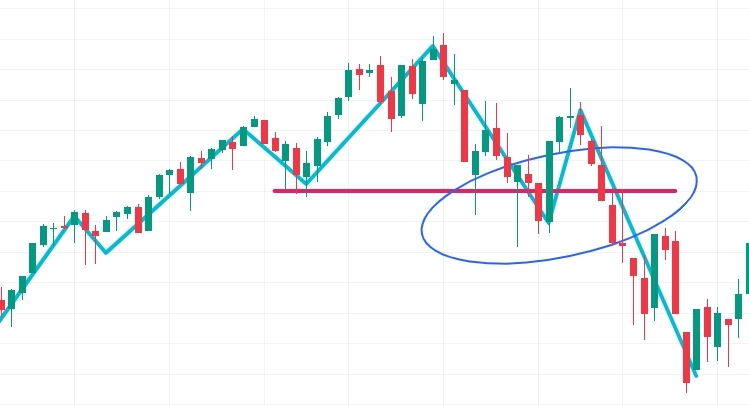
It indicates that the market has weakened and can no longer maintain the trend. This can help you identify important turning points.
Here's a real case with the S&P 500 index, in October 2020.
Most examples won't look like this (a significant downward trend once the trend is broken), but it shows the possible chain reaction when a strong trend is disrupted.
Creating a model to analyze each fluctuation in a trend, should you become more aggressive or reduce your position? Should you join the trend or start looking for counter-trend trades?
Linking the current position to its current trend is important. A few key questions to ask are:
(Fluctuation refers to the range between high and low points within a trend movement.)
Trend Acceleration
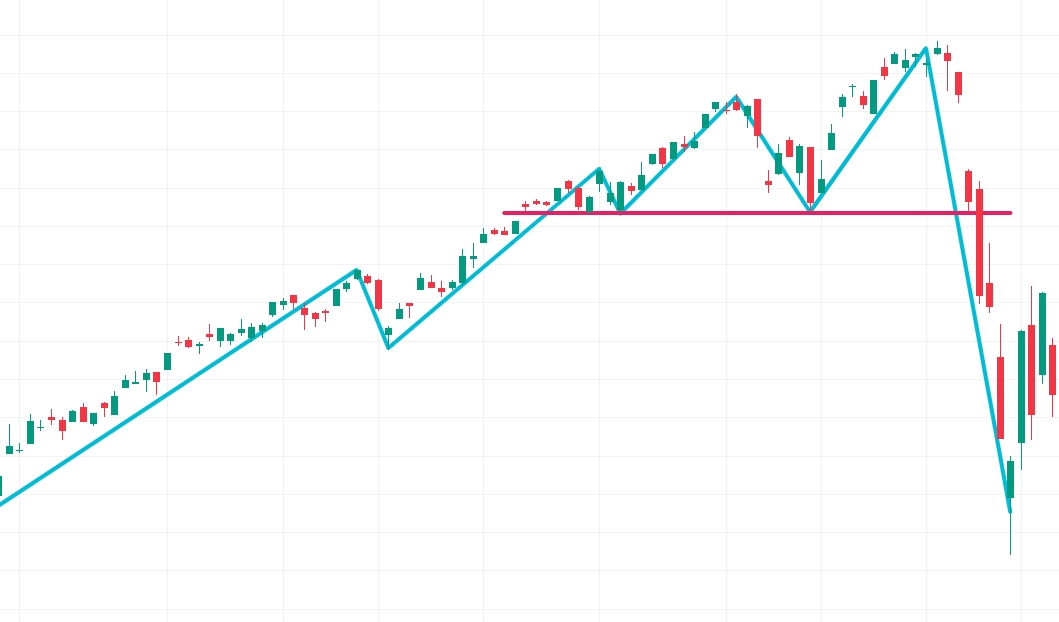
A trend's acceleration is often its final round of movement, typically characterized by many extremes in volume and sentiment.
The most obvious and relevant example is the 2017 Bitcoin bull market. Notice how, towards the end of the uptrend, the fluctuation range significantly expanded, followed by a severe pullback, ending the trend.
The price not only broke the previous low but also failed to create new higher-highs in subsequent rises.
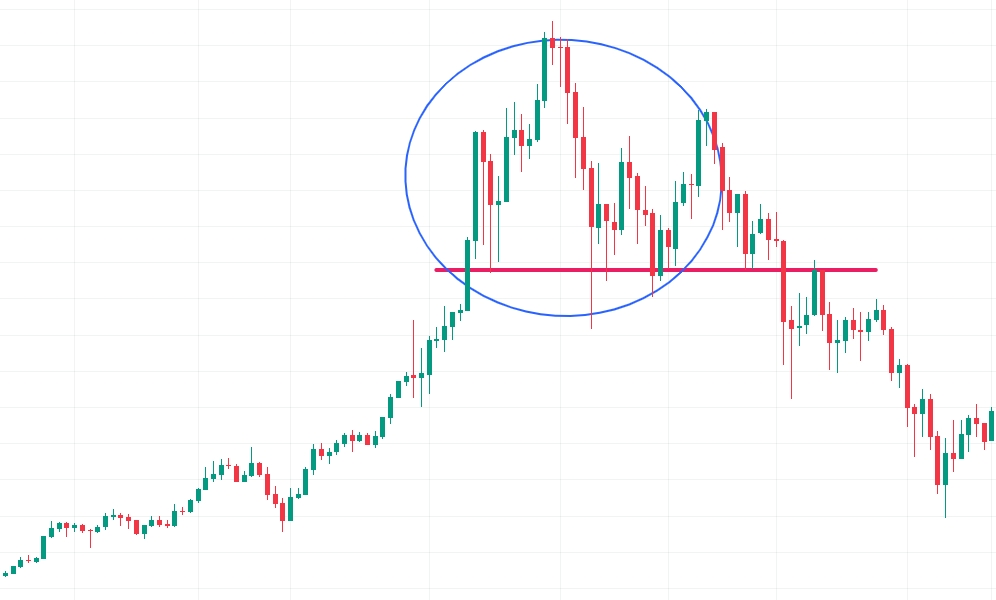
Here's another example where the outcome is still unknown. (NASDAQ:KOD)
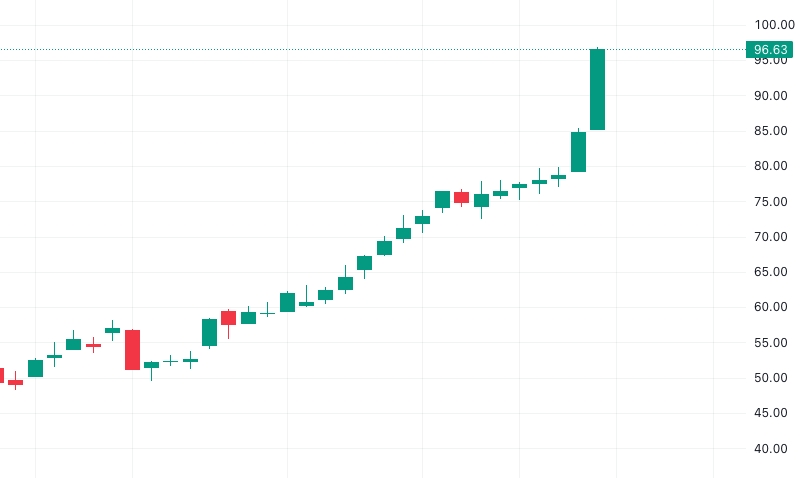
For over a month, this stock has been in a stable and strong upward trend with no pullbacks.
The stock has recently shown a parabolic trajectory.
What should we consider?
First, given that there has been no similar pullback (just like in the previous chart) yet, its strength may continue.
Furthermore, the last two bullish candles are strong and lack upper shadows, indicating minimal noticeable pullbacks.
Here's another scenario where the future trend is unknown.
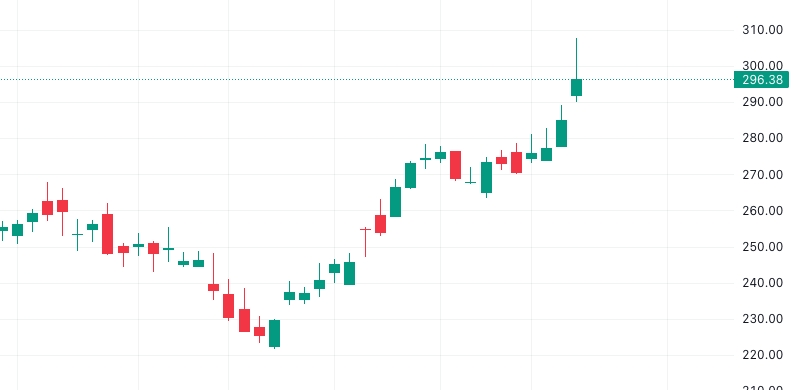
This stock is in a short-term upward trend and has recently broken through a resistance level.
The breakthrough candle is an "inverted hammer" candlestick pattern, indicating a pullback after reaching significant high point during the session.
Given the general failure of most breakthroughs and the weakness after the breakthrough, a failed breakout trade might occur here.
However, as long as there is no similar adjustment to follow afterward, traders should still assume the trend is not broken until further confirmation.
It's important to check previous fluctuations to see if there are significant resistance levels at current prices; otherwise, a major downward trend is unlikely.
For most traders, consistently successful predictions of market tops and bottoms are difficult to maintain. The best approach is often to start with light positions, wait for clear signals, and then increase exposure.
This article is not about useless predictions.
Nor is it about trying to trade solely at the bottom or top; it’s more about recognizing market conditions and dynamics that could indicate the beginning of significant shifts, creating highly favorable trading setups.
These conditions often occur at extreme price tops and bottoms. In such extreme situations, the risk of prediction is clearly too high, and we must wait for further market validation.
In trading practice, to spot potential market bottoms and tops, many investors use a combination of technical analysis tools such as support and resistance levels, trend lines, volatility indicators, price patterns, and trading volume. They closely monitor changes in price movements to more accurately predict potential market directions.
