Saudi Stocks Annual Review: Small-Cap Lead the Index; Capital Goods Sector Gains Over 60%; RED SEA Up Nearly 160% YTD
RED SEA 4230.SA | 56.10 | -1.06% |
SAUDI RE 8200.SA | 46.10 | -2.43% |
EIC 1303.SA | 7.34 | -2.00% |
Tadawul All Shares Index TASI.SA | 11892.44 | -0.57% |
GO TELECOM 7040.SA | 113.00 | -0.35% |
How did the Saudi stock market perform overall in 2024? Which sectors stood out with the most remarkable performance? And which individual stocks became the most noteworthy to watch for the year?
Index Performance
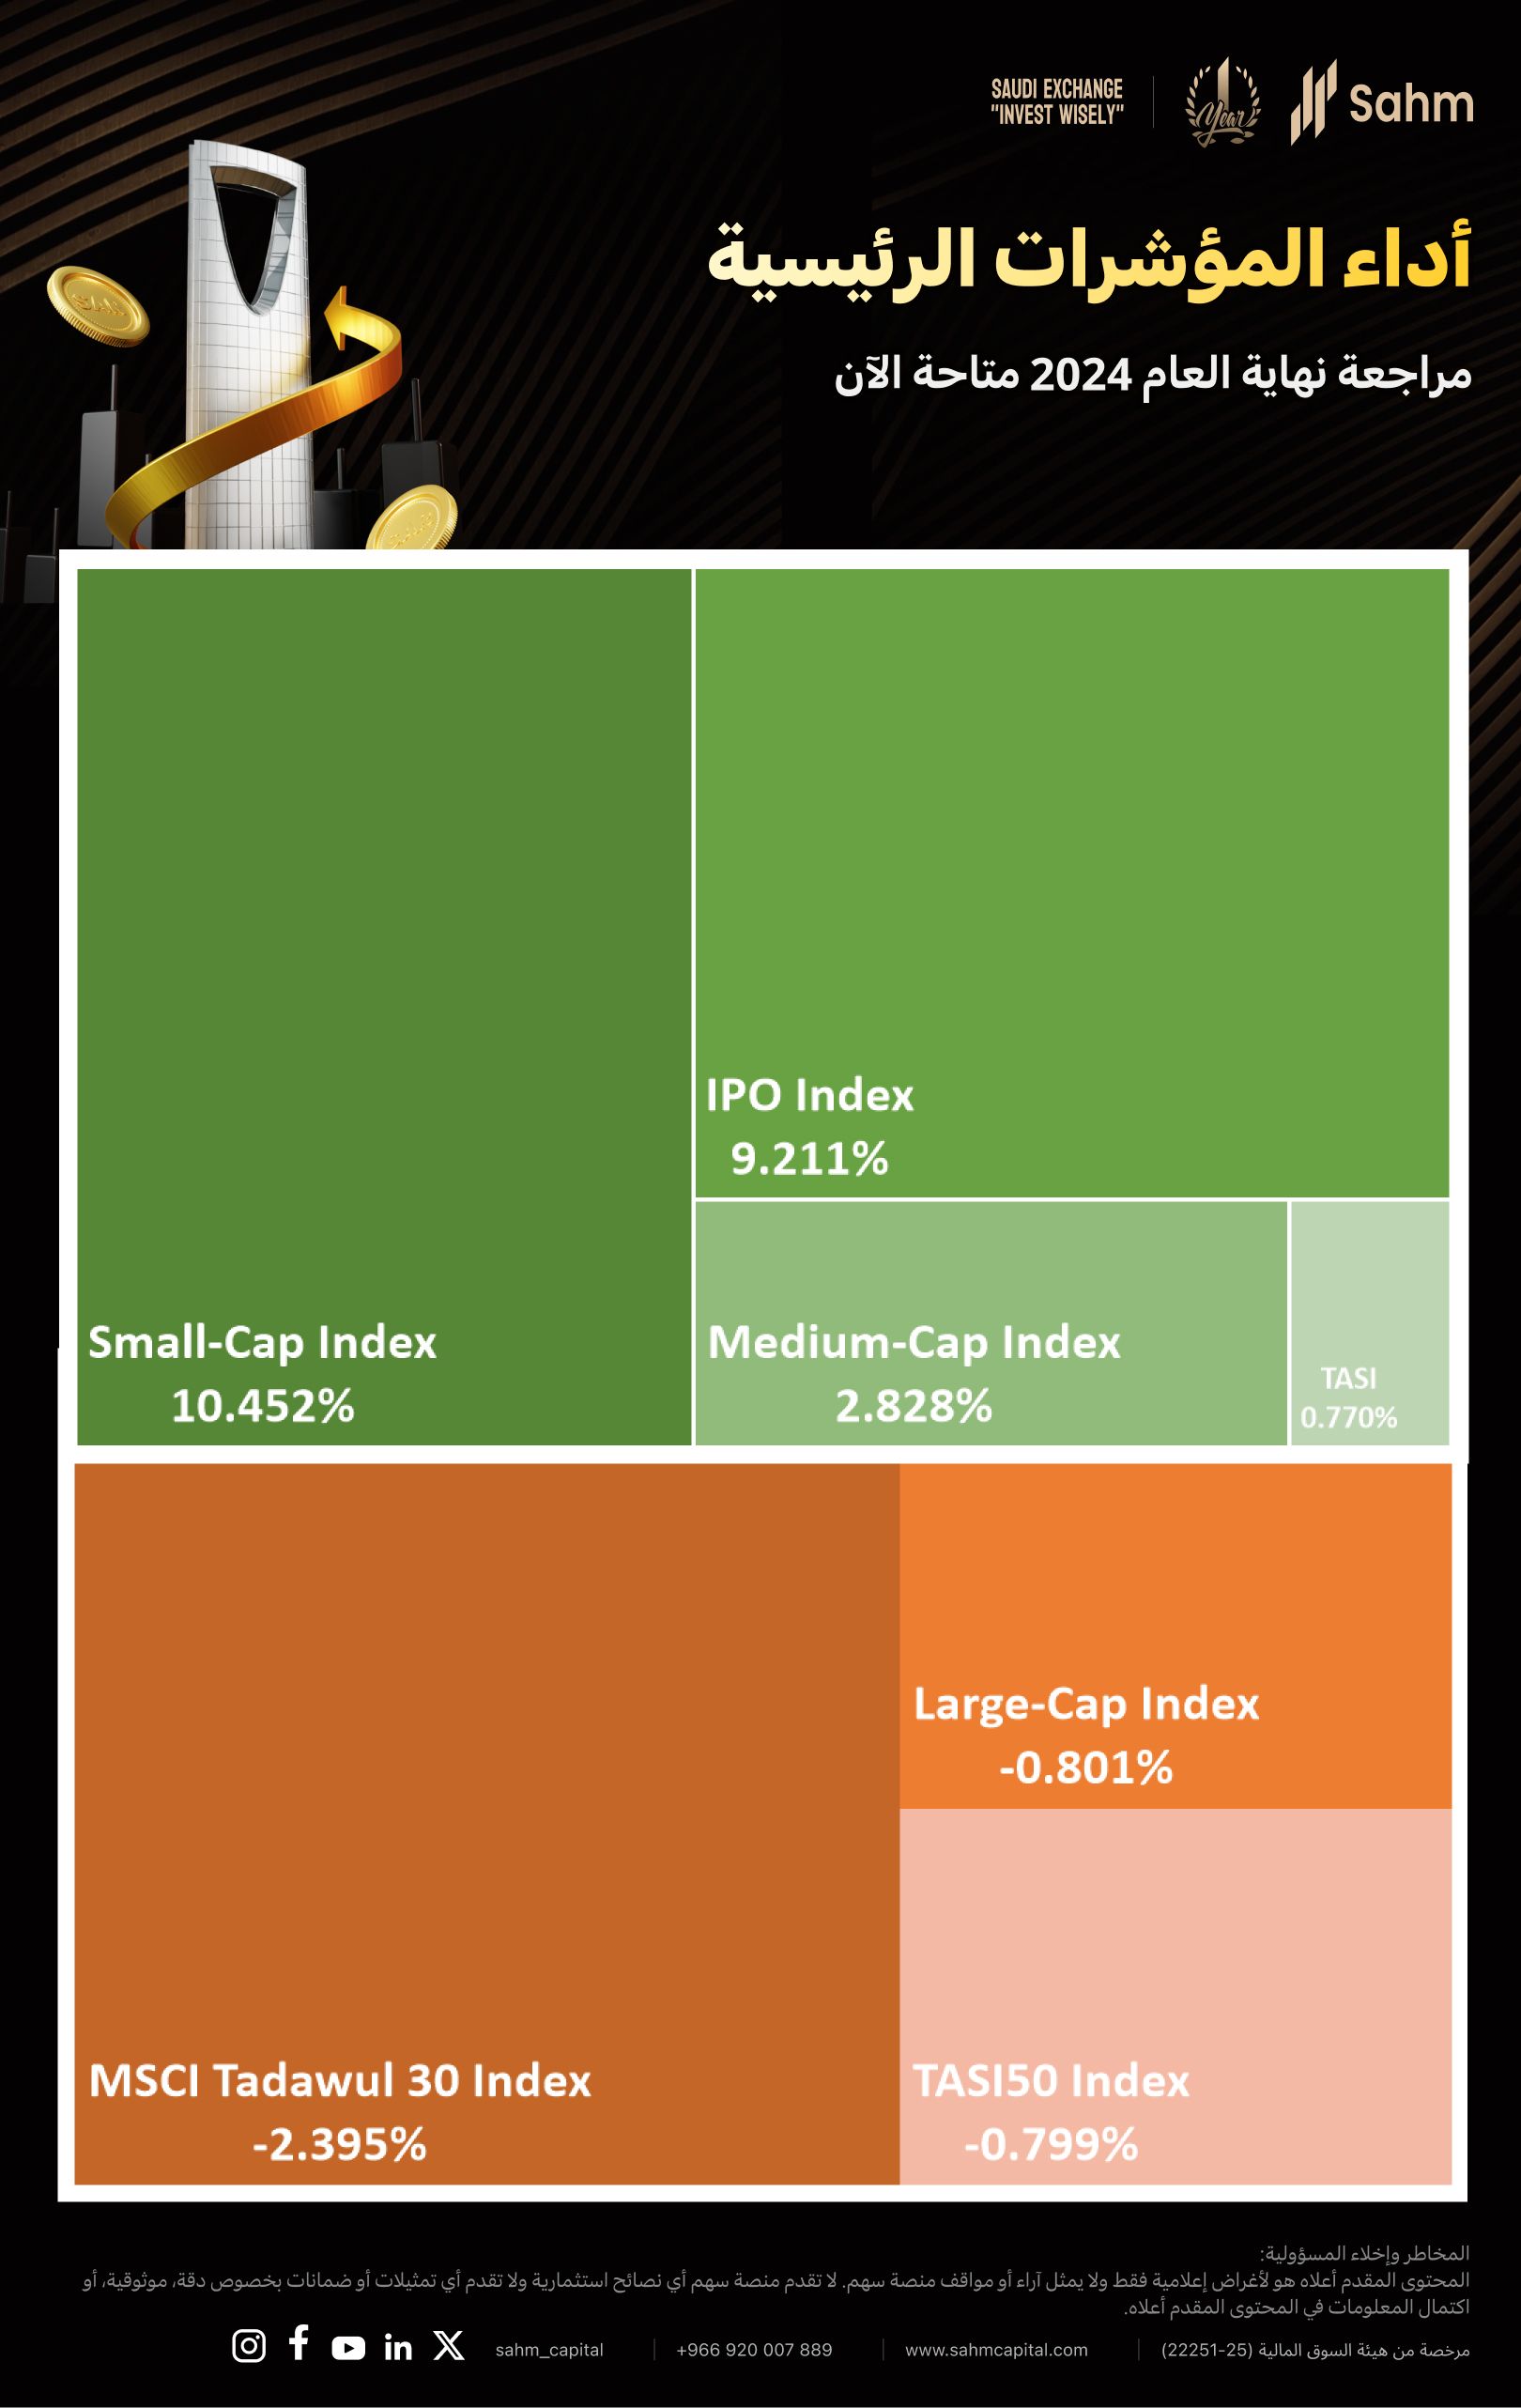
As of the close of December 15, 2024, the Tadawul All Shares Index(TASI.SA) closed at 12059.53 points, with a year-to-date increase of approximately 0.77%, having previously surged to over 12880.
When examining the indices separately, a noticeable differentiation emerges. Over the period, the Small-Cap Index has accumulated an increase of around 10.45%, while the IPO Index, representing new stocks, has risen by 9.21%. Conversely, the Large-Cap Index has experienced a decline of approximately 0.8%, and the MT30 has fallen by about 2.4%.
These data illustrate that in 2024, the Saudi market has seen the ascendancy of mid and small-cap stocks as market leaders, while large-cap stocks have exhibited slightly less robust performance.

Sectors Performance
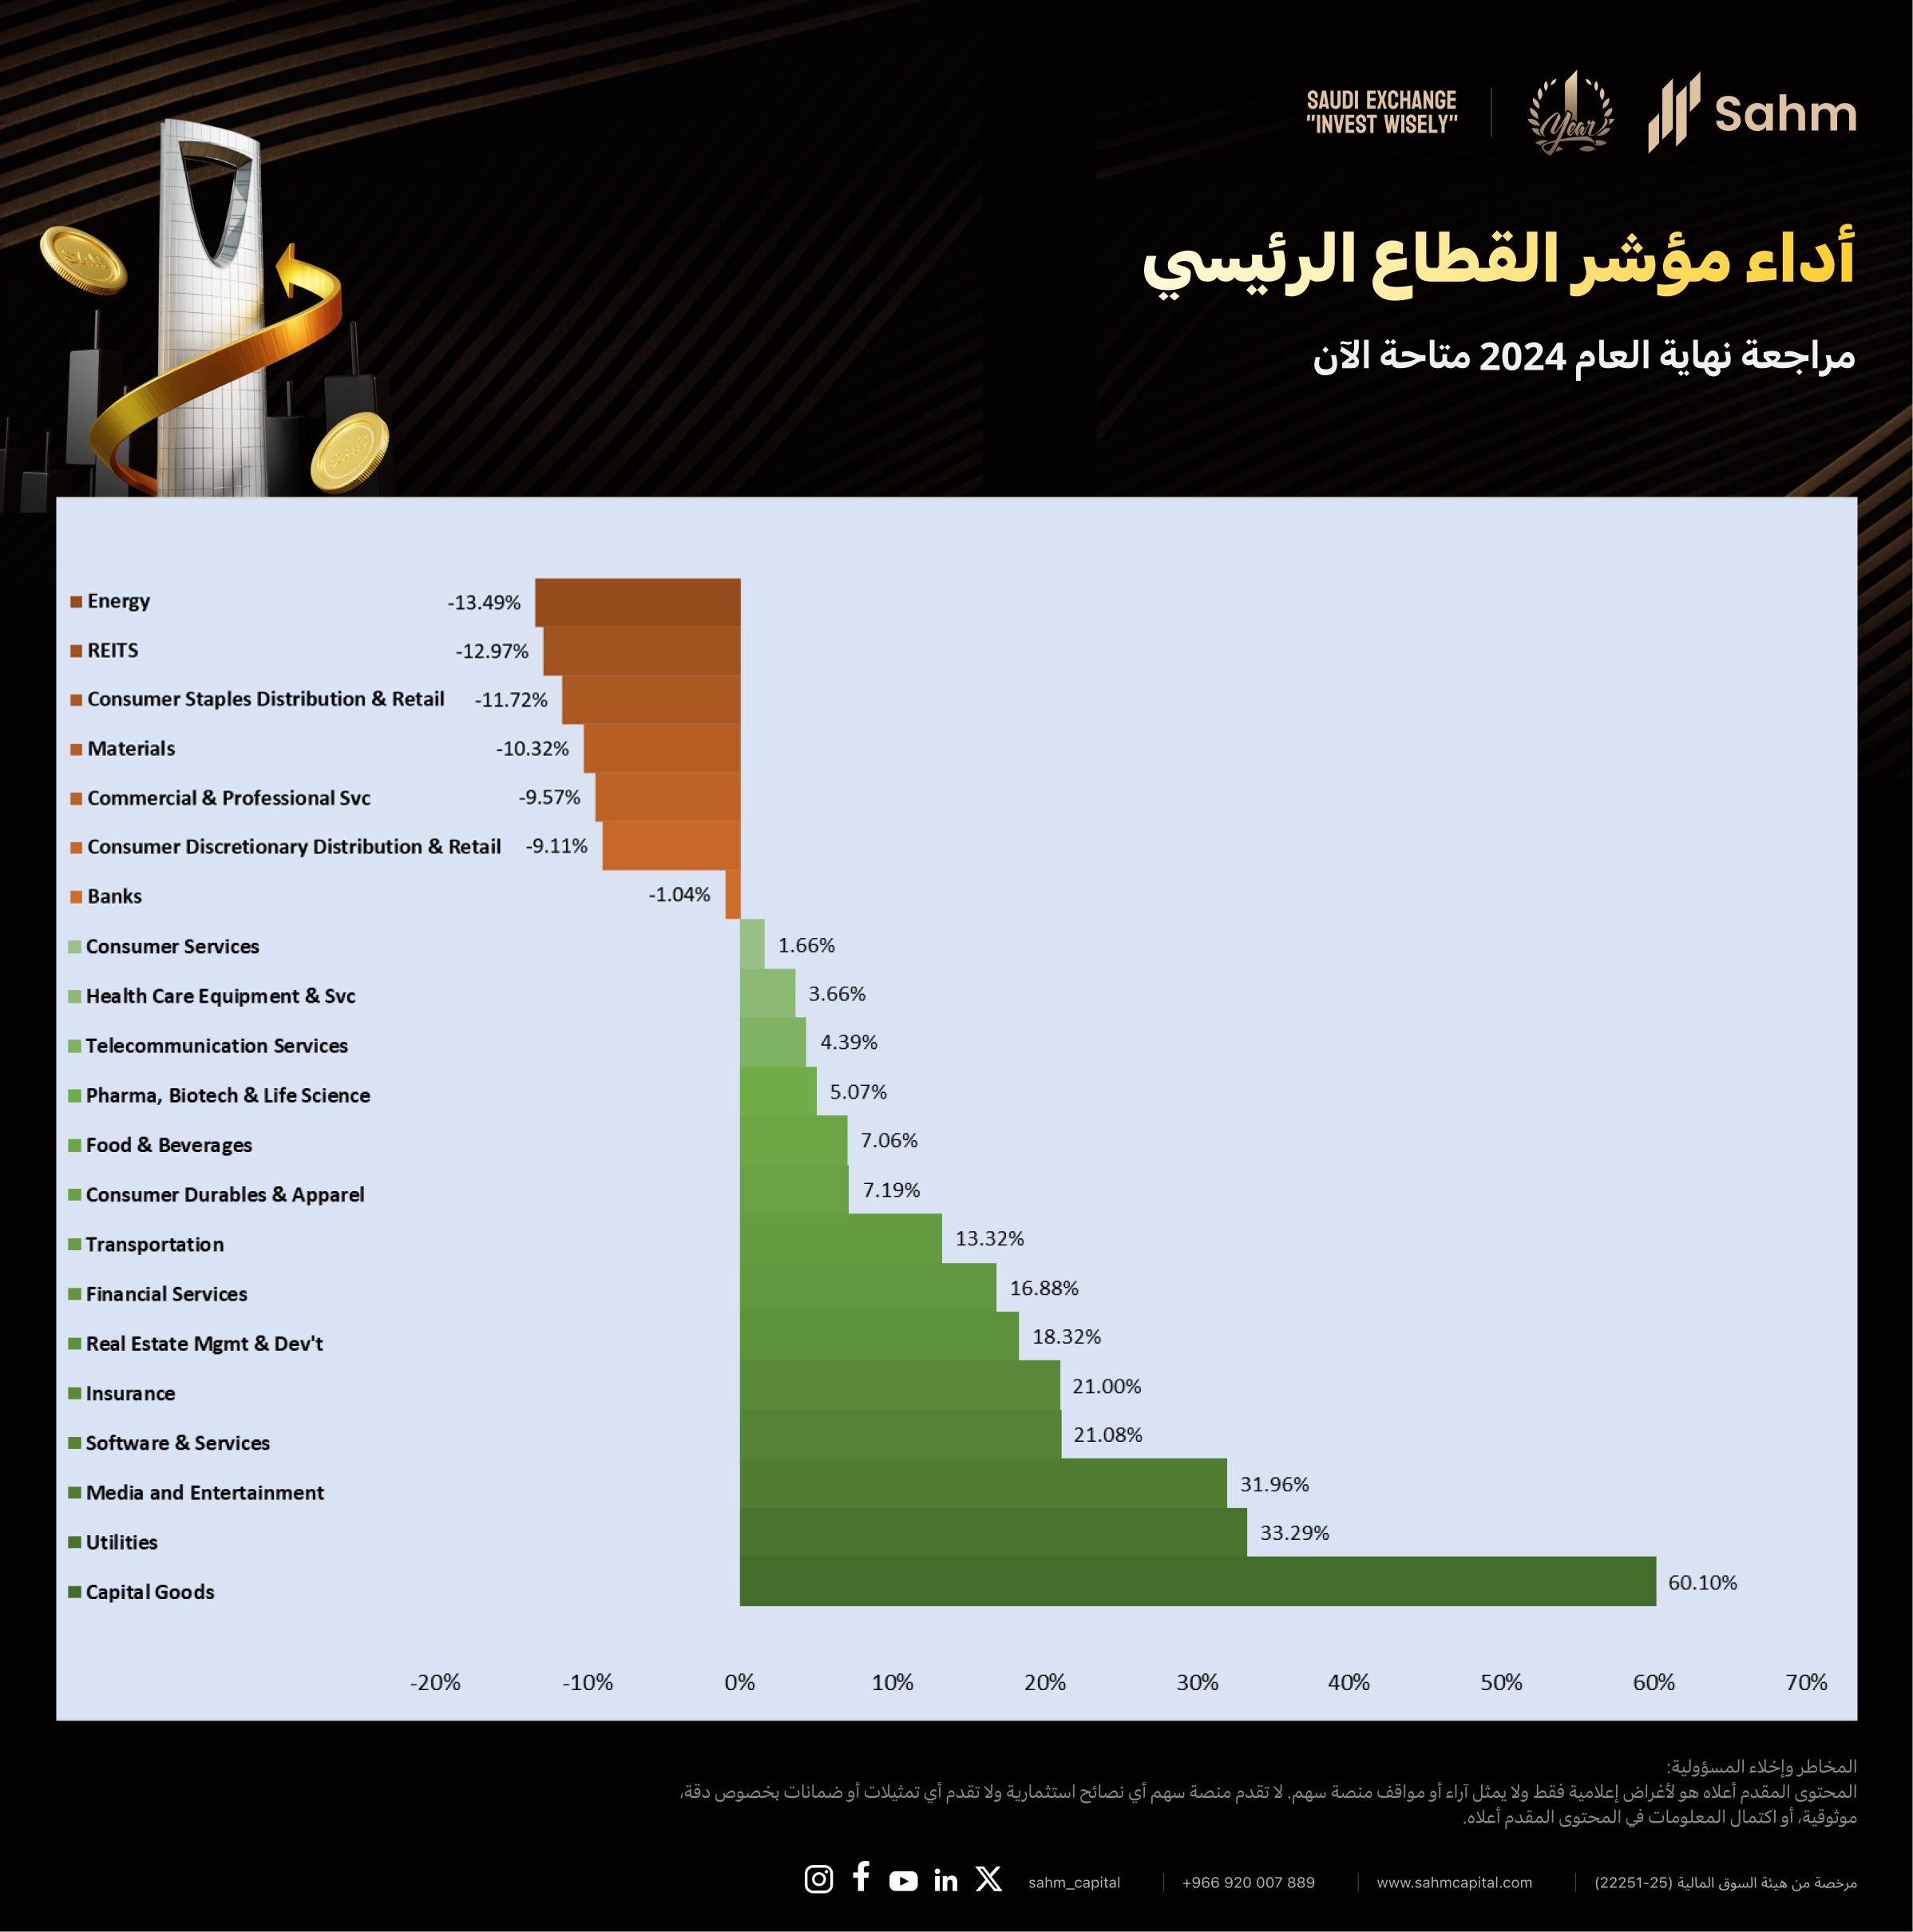
As of the close of December 15, 2024, out of the 21 sector indices, 14 showed gains, accounting for approximately 66.7% of the sectors, while the remaining 7 indices experienced declines.
During the period in review, the Capital Goods sector accumulated an increase of 60.1%, while the Utilities and Media and Entertainment sectors saw gains of over 30%. The Software & Services and Insurance sectors also experienced increases of over 20%. On the other hand, the Energy, REITS, Consumer Staples Distribution & Retail, and Materials sectors all declined by over 10%.

Note: We have compiled data for a total of 22 sectors according to the classification of the Saudi Stock Exchange. However, the Household & Personal Products index contains only one stock, and as such, the data is not considered to be significantly useful as it is not represented in our chart.
Top 30 Strongest Stocks
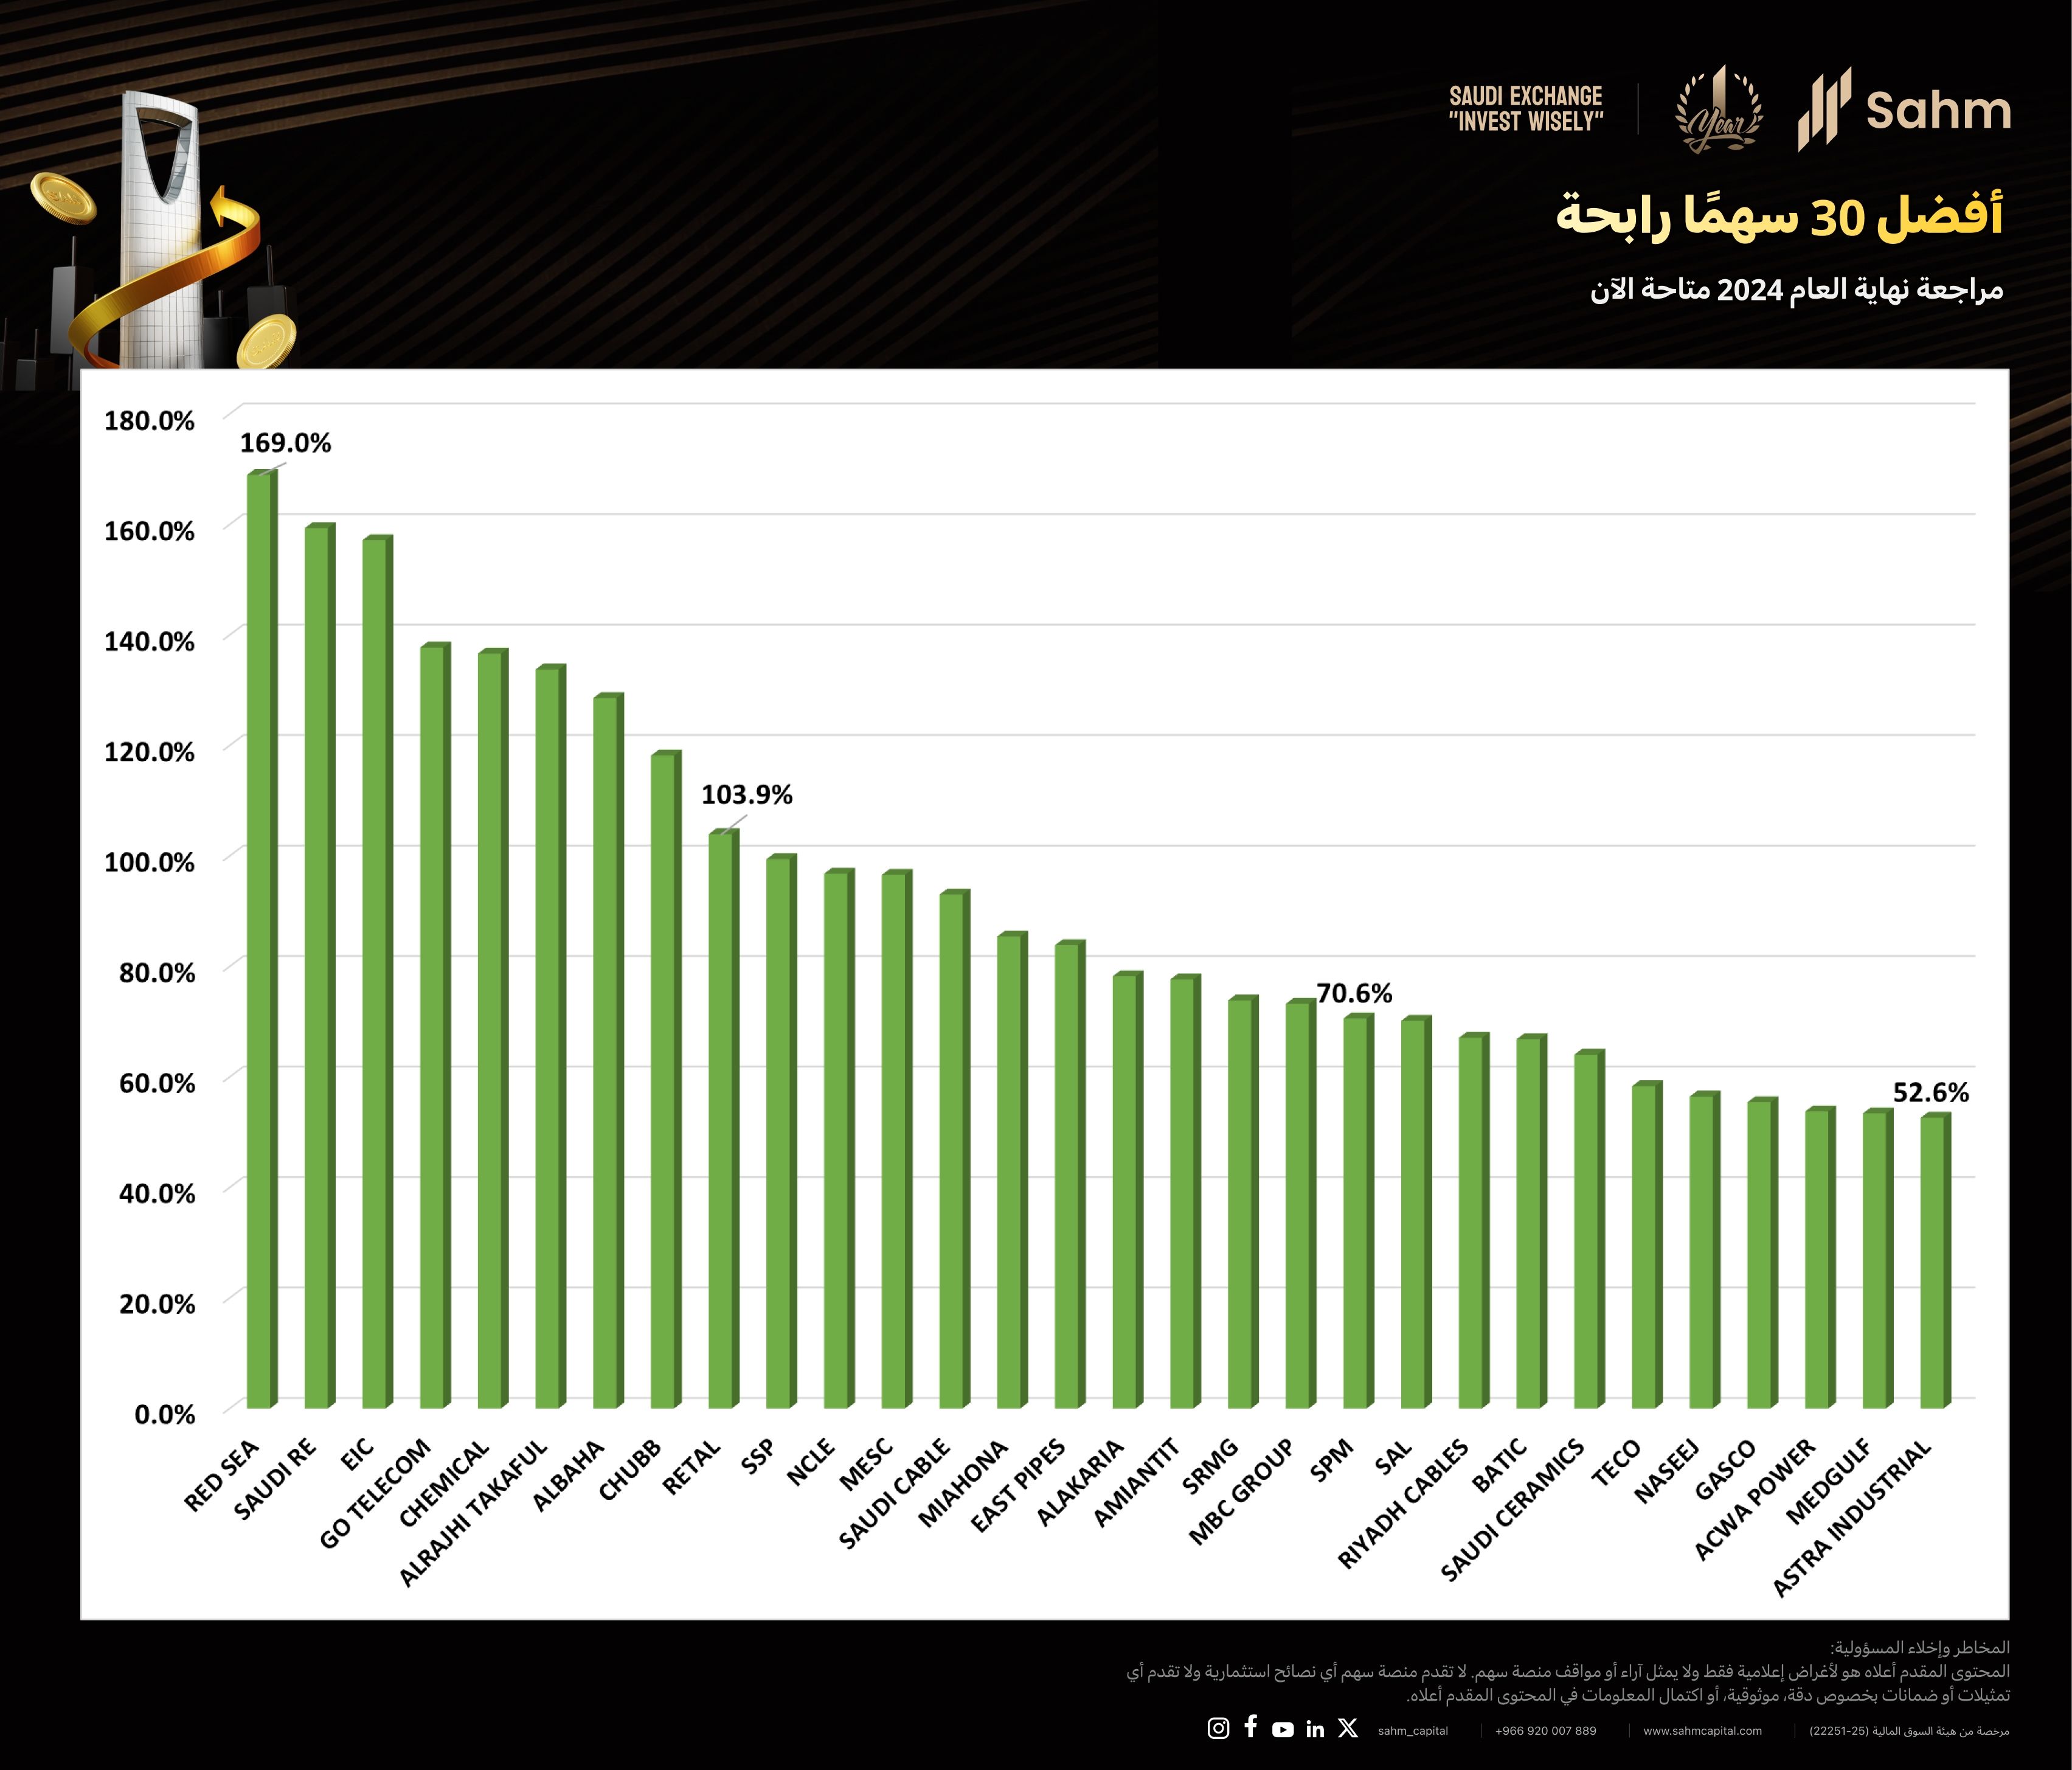
Based on the "1-year change" statistics, we have compiled a list of the top 30 stocks with the highest increases in the market. All 30 of these stocks have seen increases of over 50%, with an average increase of approximately 92.4%. In total, 9 stocks have surpassed a 100% increase, and 13 stocks have achieved an increase of over 90%.
Among these, Red Sea International Co.(4230.SA) has seen an increase of nearly 169% over the past year (or approximately 157.4% for the year**), ranking first. Saudi Reinsurance Co.(8200.SA) and Electrical Industries Co.(1303.SA) , the second and third-ranked stocks, have also seen increases of over 150% in the past year.

**Note: To facilitate the assessment, we directly utilized the "1-year change" data of stocks from the Saudi Stock Exchange. This implies that the actual price change is between December 18, 2023, and December 17, 2024. After a sampling check, we found no significant difference compared to the list calculated from January 1, 2024, and concluded that the impact on the findings can be disregarded.
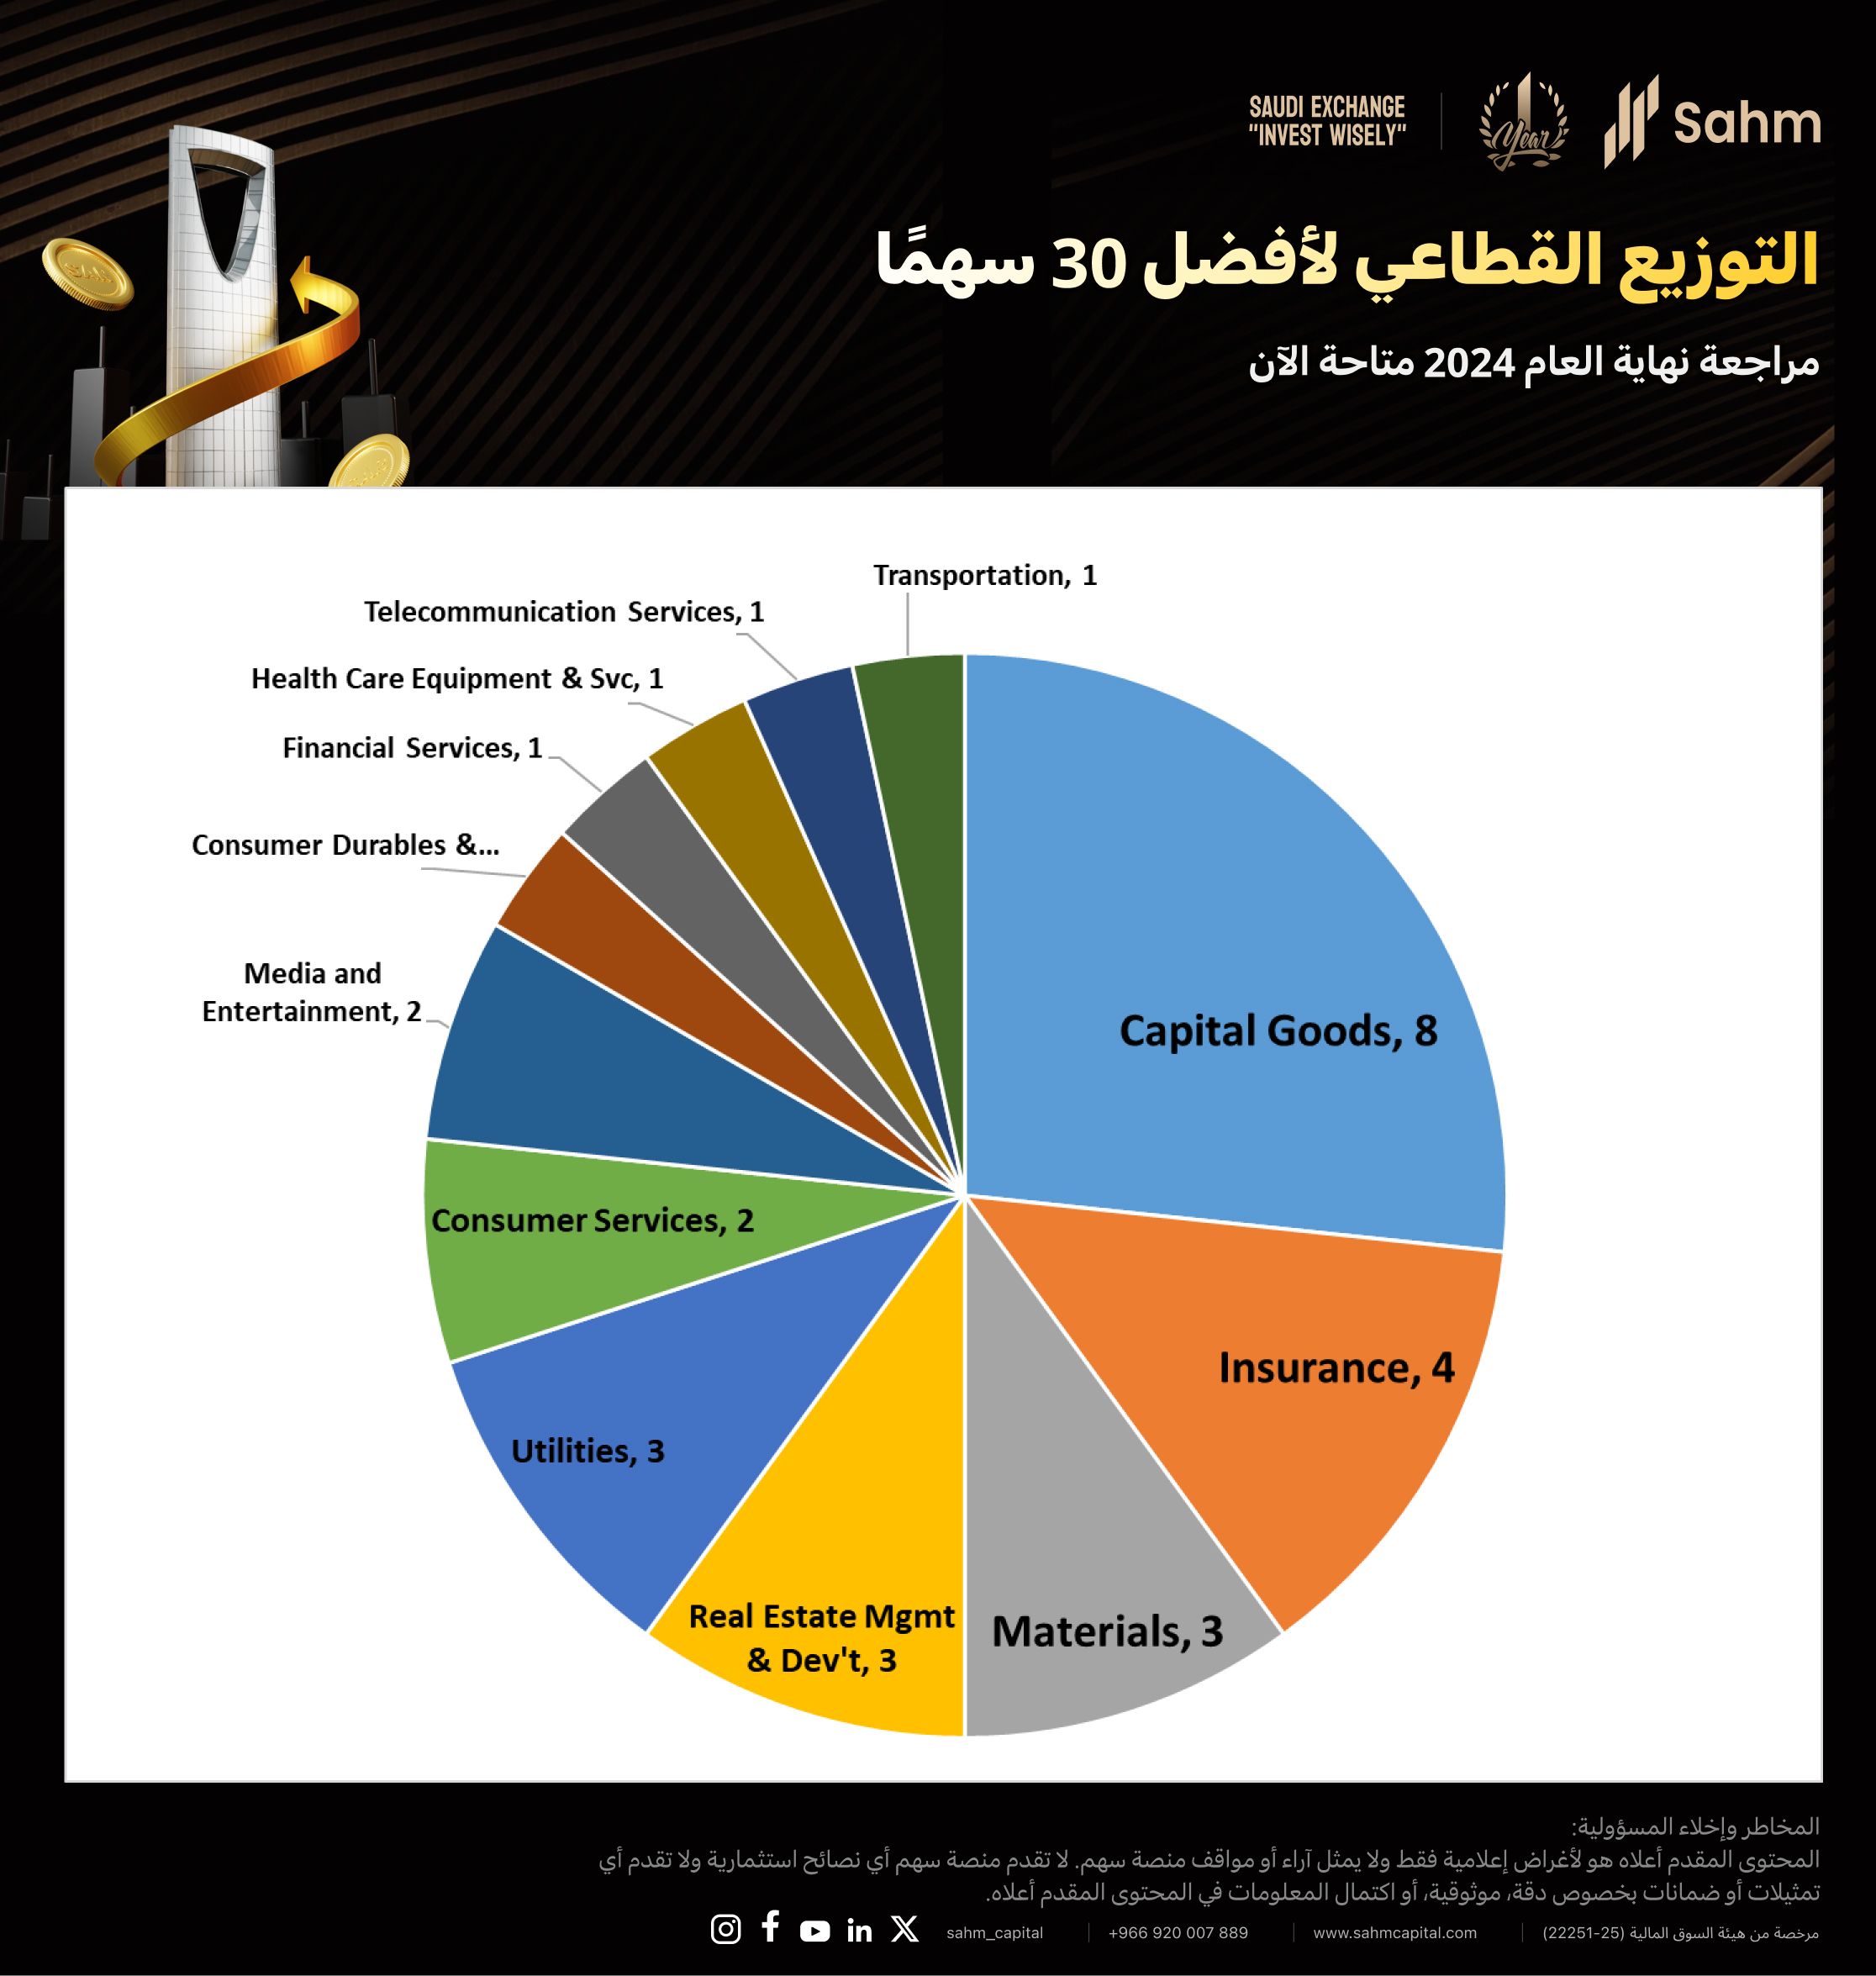
Furthermore, the Capital Goods sector has the highest representation among these 30 stocks, with a total of 8 stocks. Insurance and Materials sectors rank second and third, with 4 and 3 stocks respectively.
Referencing the second part of this article, it is apparent that while the Capital Goods and Insurance sectors have performed exceptionally well this year, the Materials sector has underperformed. This implies that there may be greater opportunities in the best-performing sectors to seek out stocks, while even the sectors with relatively moderate performances may still present opportunities.

Appendix
Disclaimer: The original data mentioned above is sourced from the Saudi Stock Exchange and other public sources. We have visualized this data to facilitate a better understanding of the Saudi market for readers. The indices and individual stocks discussed in the article are purely for the presentation of objective statistical results and should not be interpreted as investment advice.


