
Please use a PC Browser to access Register-Tadawul
Get It
How to Profit from Technical Analysis: A Practical Guide to Trading the VCP Pattern
Tadawul All Shares Index TASI.SA | 0.00 | |
EIC 1303.SA | 0.00 | |
ETF-S&P 500 SPY | 0.00 | |
PowerShares QQQ Trust,Series 1 QQQ | 0.00 | |
ETF-Dow Jones Industrial Average DIA | 0.00 |
The Volatility Contraction Pattern (VCP) is a key formation that swing traders can leverage to identify stocks poised for significant price movements. This pattern indicates a reduction in selling pressure as a stock goes through price and volume contractions, often setting the stage for a breakout.
Trapped Buyers (TBs): Investors who purchased at higher prices and are now holding losses as the stock declined. These traders may sell at near breakeven levels, creating resistance.
Bottom Fishers (BFs): Opportunistic investors seek to buy near perceived lows, supporting the price during contractions.
Profit Taking (PT): As the stock recovers, early buyers may lock in gains, leading to temporary pullbacks.
Loss Cutting (LC): Some traders exit their positions to minimize losses during price drops, contributing to downward momentum.
Below, I’ve used the recent price movement of Saudi stock Electrical Industries Co.(1303.SA) to better illustrate how the specific setup unfolds.
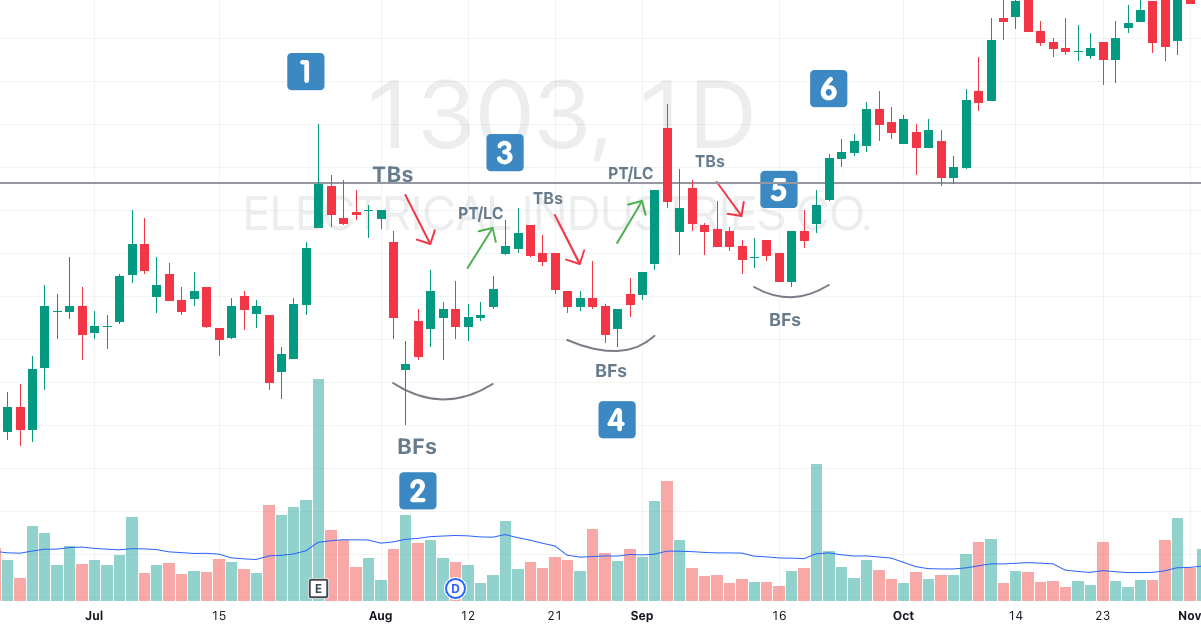
1. Initial Decline: The stock experiences a sharp drop, usually with high trading volume, reflecting significant selling pressure.
2. First Contraction: Price stabilizes and the trading range narrows. Diminishing volume signals reduced selling activity.
3. Advance: The stock rises, often encountering resistance from TBs selling near their purchase levels.
4. Second Contraction: A higher low forms compared to the initial bottom, and volume decreases further, showing sellers are stepping back.
5. Subsequent Moves: Repeated contractions occur, each shallower than the last, with lower volume. This signals a shift as demand starts to dominate supply.
6. Breakout: The stock finally breaks out from the pattern on rising volume, confirming the strength of the move.
When using the VCP strategy, traders should focus on these key points:
While the VCP is a reliable technical setup, no pattern is infallible. To improve the probability of success, consider combining the VCP with other technical indicators or methods that confirm the underlying trend or provide clearer trading signals. Here are some approaches to enhance your strategy:
Moving Averages: Use the 20-day or 50-day moving average to identify the overall trend direction. A stock breaking out from a VCP while remaining above these moving averages often signals strength. Moving averages can also act as dynamic support or resistance levels during contractions.
Relative Strength Index (RSI): Check for overbought or oversold conditions. An RSI reading above 50 during a breakout often supports bullish momentum, while extreme overbought conditions may warrant caution.
Support and Resistance Zones: Align the VCP breakout with well-defined support and resistance levels. A breakout above a historical resistance zone often adds weight to the pattern's reliability.
Market Breadth Indicators: Evaluate the overall health of the market with breadth indicators like the Advance-Decline Line or percentage of stocks trading above their 200-day moving average or even the 20-day moving average. A strong general market trend can provide a supportive environment for individual breakouts.
By combining the VCP with these additional tools and maintaining a disciplined risk management plan, traders can better navigate the markets and filter out misleading signals. Always ensure that your analysis aligns with the broader market trend and the unique dynamics of the stock you're trading.
