Cracking The Code: Understanding Analyst Reviews For Holley
Holley Inc. Common Stock HLLY | 3.05 | +1.33% |
Holley (NYSE:HLLY) underwent analysis by 6 analysts in the last quarter, revealing a spectrum of viewpoints from bullish to bearish.
The table below provides a concise overview of recent ratings by analysts, offering insights into the changing sentiments over the past 30 days and drawing comparisons with the preceding months for a holistic perspective.
| Bullish | Somewhat Bullish | Indifferent | Somewhat Bearish | Bearish | |
|---|---|---|---|---|---|
| Total Ratings | 3 | 2 | 1 | 0 | 0 |
| Last 30D | 1 | 0 | 0 | 0 | 0 |
| 1M Ago | 2 | 1 | 0 | 0 | 0 |
| 2M Ago | 0 | 1 | 1 | 0 | 0 |
| 3M Ago | 0 | 0 | 0 | 0 | 0 |
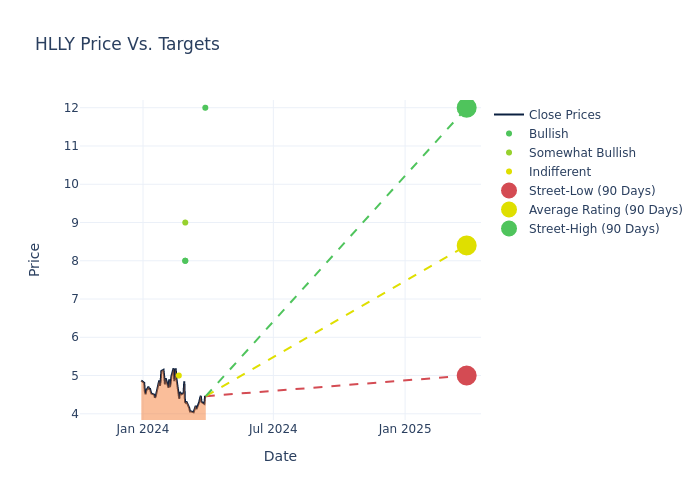
Analysts' evaluations of 12-month price targets offer additional insights, showcasing an average target of $8.5, with a high estimate of $12.00 and a low estimate of $5.00. Surpassing the previous average price target of $8.17, the current average has increased by 4.04%.

Interpreting Analyst Ratings: A Closer Look
The standing of Holley among financial experts is revealed through an in-depth exploration of recent analyst actions. The summary below outlines key analysts, their recent evaluations, and adjustments to ratings and price targets.
| Analyst | Analyst Firm | Action Taken | Rating | Current Price Target | Prior Price Target |
|---|---|---|---|---|---|
| John Lawrence | Benchmark | Maintains | Buy | $12.00 | - |
| Brian McNamara | Canaccord Genuity | Lowers | Buy | $8.00 | $9.00 |
| Michael Swartz | Truist Securities | Lowers | Buy | $8.00 | $9.00 |
| Joseph Feldman | Telsey Advisory Group | Maintains | Outperform | $9.00 | - |
| Joseph Feldman | Telsey Advisory Group | Maintains | Outperform | $9.00 | - |
| Christian Carlino | JP Morgan | Lowers | Neutral | $5.00 | $6.50 |
Key Insights:
- Action Taken: In response to dynamic market conditions and company performance, analysts update their recommendations. Whether they 'Maintain', 'Raise', or 'Lower' their stance, it signifies their reaction to recent developments related to Holley. This insight gives a snapshot of analysts' perspectives on the current state of the company.
- Rating: Analysts unravel qualitative evaluations for stocks, ranging from 'Outperform' to 'Underperform'. These ratings offer insights into expectations for the relative performance of Holley compared to the broader market.
- Price Targets: Gaining insights, analysts provide estimates for the future value of Holley's stock. This comparison reveals trends in analysts' expectations over time.
To gain a panoramic view of Holley's market performance, explore these analyst evaluations alongside essential financial indicators. Stay informed and make judicious decisions using our Ratings Table.
Stay up to date on Holley analyst ratings.
If you are interested in following small-cap stock news and performance you can start by tracking it here.
Discovering Holley: A Closer Look
Holley Inc is a designer, marketer, and manufacturer of high-performance automotive aftermarket products, featuring a portfolio of iconic brands serving the car and truck industry. It offers a diversified line of performance automotive products including fuel injection systems, tuners, exhaust products, carburetors, safety equipment and various other performance automotive products. The Company's products are designed to enhance street, off-road, recreational and competitive vehicle performance through increased horsepower, torque and drivability. The company's brands include Holley, APR, MSD and Flowmaster, among others. It derives revenue from the U.S. and Italy, of which prime revenue is derived from the U.S.
Holley's Financial Performance
Market Capitalization: Indicating a reduced size compared to industry averages, the company's market capitalization poses unique challenges.
Revenue Growth: Over the 3 months period, Holley showcased positive performance, achieving a revenue growth rate of 1.0% as of 31 December, 2023. This reflects a substantial increase in the company's top-line earnings. In comparison to its industry peers, the company trails behind with a growth rate lower than the average among peers in the Consumer Discretionary sector.
Net Margin: Holley's financial strength is reflected in its exceptional net margin, which exceeds industry averages. With a remarkable net margin of 0.77%, the company showcases strong profitability and effective cost management.
Return on Equity (ROE): Holley's ROE surpasses industry standards, highlighting the company's exceptional financial performance. With an impressive 0.27% ROE, the company effectively utilizes shareholder equity capital.
Return on Assets (ROA): Holley's ROA stands out, surpassing industry averages. With an impressive ROA of 0.1%, the company demonstrates effective utilization of assets and strong financial performance.
Debt Management: Holley's debt-to-equity ratio surpasses industry norms, standing at 1.34. This suggests the company carries a substantial amount of debt, posing potential financial challenges.
What Are Analyst Ratings?
Within the domain of banking and financial systems, analysts specialize in reporting for specific stocks or defined sectors. Their work involves attending company conference calls and meetings, researching company financial statements, and communicating with insiders to publish "analyst ratings" for stocks. Analysts typically assess and rate each stock once per quarter.
Analysts may supplement their ratings with predictions for metrics like growth estimates, earnings, and revenue, offering investors a more comprehensive outlook. However, investors should be mindful that analysts, like any human, can have subjective perspectives influencing their forecasts.
This article was generated by Benzinga's automated content engine and reviewed by an editor.


