Conduent (NASDAQ:CNDT) shareholders are up 8.7% this past week, but still in the red over the last five years
Conduent, Inc. CNDT | 3.72 3.72 | +4.49% 0.00% Pre |
Statistically speaking, long term investing is a profitable endeavour. But that doesn't mean long term investors can avoid big losses. For example, after five long years the Conduent Incorporated (NASDAQ:CNDT) share price is a whole 65% lower. That is extremely sub-optimal, to say the least. On the other hand the share price has bounced 8.7% over the last week.
While the last five years has been tough for Conduent shareholders, this past week has shown signs of promise. So let's look at the longer term fundamentals and see if they've been the driver of the negative returns.
Given that Conduent didn't make a profit in the last twelve months, we'll focus on revenue growth to form a quick view of its business development. Generally speaking, companies without profits are expected to grow revenue every year, and at a good clip. That's because it's hard to be confident a company will be sustainable if revenue growth is negligible, and it never makes a profit.
Over half a decade Conduent reduced its trailing twelve month revenue by 5.4% for each year. That's not what investors generally want to see. With neither profit nor revenue growth, the loss of 11% per year doesn't really surprise us. The chance of imminent investor enthusiasm for this stock seems slimmer than Louise Brooks. Not that many investors like to invest in companies that are losing money and not growing revenue.
The graphic below depicts how earnings and revenue have changed over time (unveil the exact values by clicking on the image).
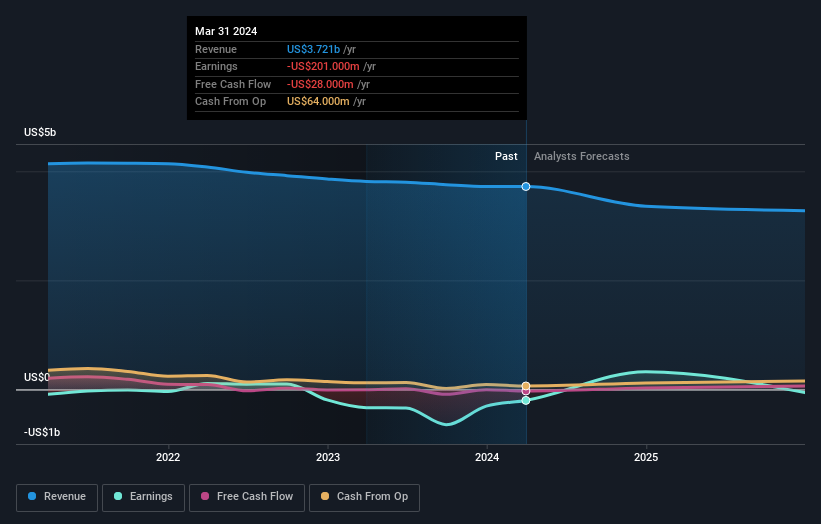
Take a more thorough look at Conduent's financial health with this free report on its balance sheet.
A Different Perspective
Investors in Conduent had a tough year, with a total loss of 2.9%, against a market gain of about 25%. Even the share prices of good stocks drop sometimes, but we want to see improvements in the fundamental metrics of a business, before getting too interested. However, the loss over the last year isn't as bad as the 11% per annum loss investors have suffered over the last half decade. We would want clear information suggesting the company will grow, before taking the view that the share price will stabilize. Shareholders might want to examine this detailed historical graph of past earnings, revenue and cash flow.
If you like to buy stocks alongside management, then you might just love this free list of companies. (Hint: many of them are unnoticed AND have attractive valuation).
Please note, the market returns quoted in this article reflect the market weighted average returns of stocks that currently trade on American exchanges.
This article by Simply Wall St is general in nature. We provide commentary based on historical data and analyst forecasts only using an unbiased methodology and our articles are not intended to be financial advice. It does not constitute a recommendation to buy or sell any stock, and does not take account of your objectives, or your financial situation. We aim to bring you long-term focused analysis driven by fundamental data. Note that our analysis may not factor in the latest price-sensitive company announcements or qualitative material. Simply Wall St has no position in any stocks mentioned.