What is an ascending channel?
An ascending channel occurs when analyzing an overall uptrend in the asset price. It is a series of price highs and lows contained between upward-sloping parallel lines. These trendlines act as resistance and support for the asset price as it advances. The price must approach the support or resistance line at least twice before an ascending channel is confirmed.
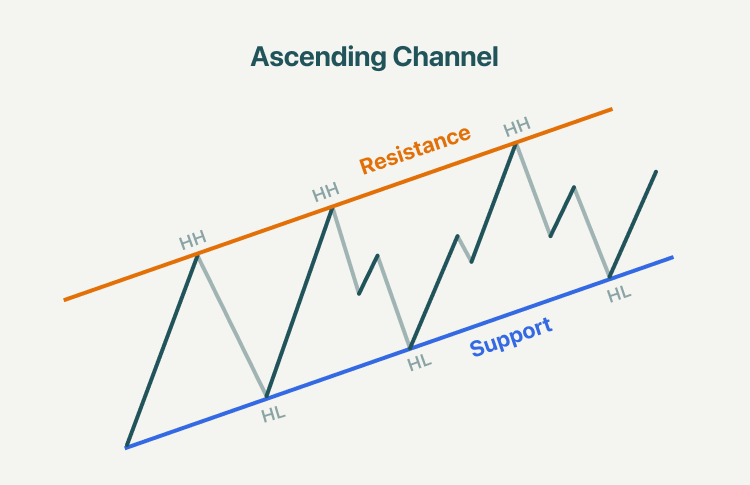
Ascending channels are continuation patterns that are strongly indicative of bullishness. They suggest that a trend has been established that will likely continue moving forward. Also, ascending channels imply that an asset has been growing steadily in a certain direction over a period of time. This growing trend can be an important factor in determining how long it will take for a trader to profit from a given trade. Traders are likely to have longer holding times for these trades to be profitable based on these patterns.
What is a descending channel?
A descending channel is a chart pattern formed from two downward trend lines drawn above and below a price representing resistance and support levels. It is a bearish chart pattern defined by a trend line supporting the series of lower lows and a diagonal resistance level connecting the lower highs.
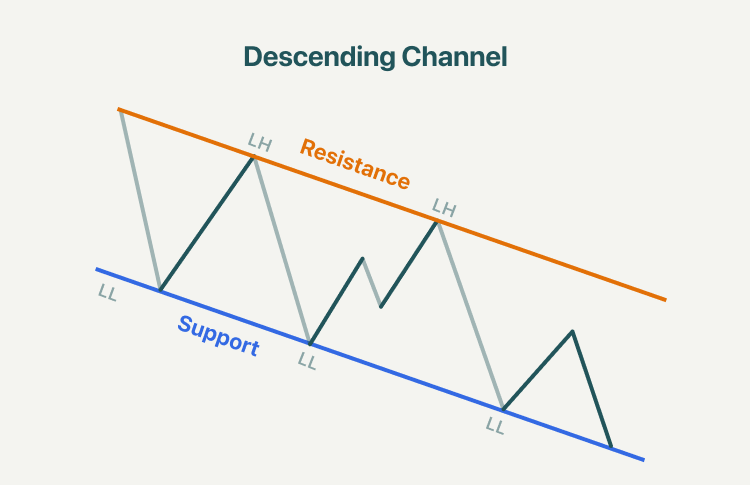
Descending channels can be used to pinpoint optimal support and resistance levels to buy or sell assets. A more potent signal occurs with a breakout, which is when an asset's price breaches an established channel's boundaries, either on the upper or lower side. When this happens, an asset's price can move quickly and sharply in the direction of that breakout. If this move is in the direction of the prior trend, the descending channel would have been a continuation pattern. If the move is counter to the prior trend, the descending channel would have been a preliminary to a reversal.
How to trade ascending channel?
1. Breakout to the downside
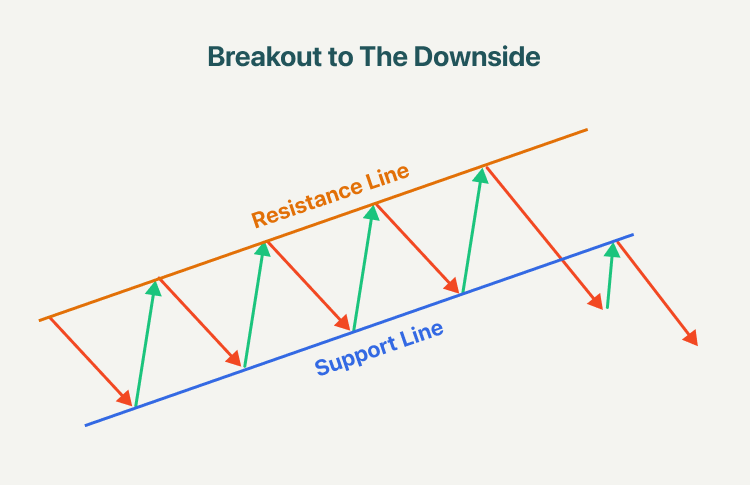
When the price of an ascending channel breaks below the lower channel line (support), it is a sign of pattern weakness. Here, traders may enter a short position on the asset.
2. Support and resistance
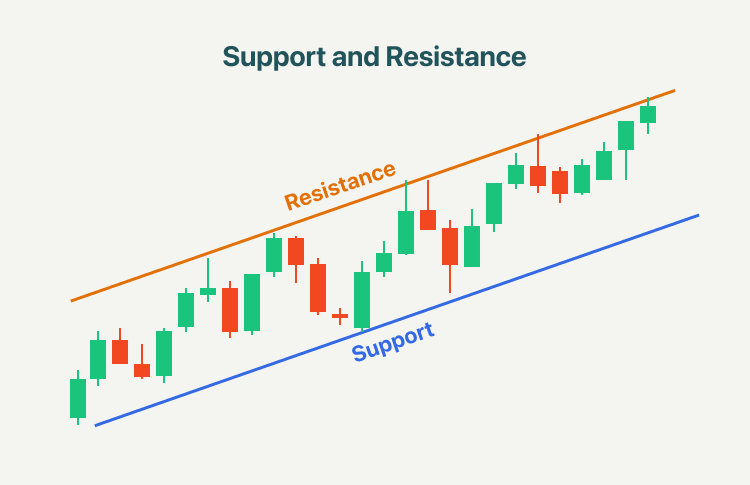
When the price of an asset comes near the ascending channel's lower trend line (support), traders may choose to enter a long position, and they may close the position when the price approaches the upper line (resistance). If it suddenly takes a turn, a stop-loss order should be placed just below the lower trend line to protect losses.
3. Breakout to the upside
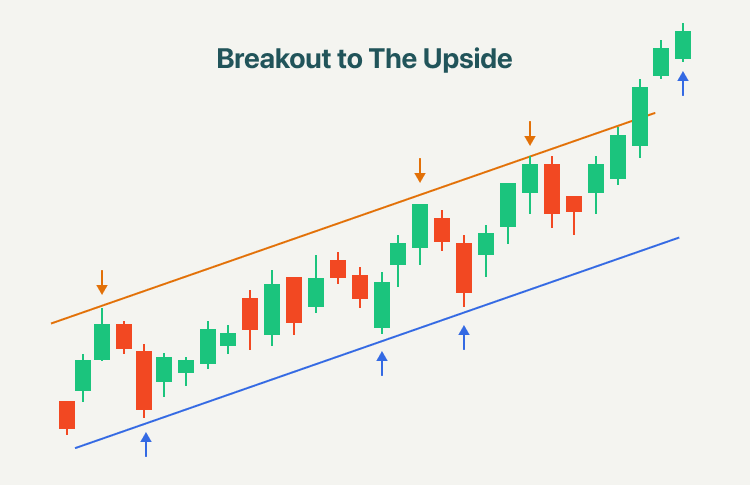
When an asset's price rises over the top of an ascending channel, traders may decide to place a buy order. It is wise to utilize additional technical tools to verify the breakout. For instance, traders may wait for the breakthrough to be accompanied by a big increase in volume. Some may want to confirm if there is any overhead resistance on charts in higher time frames before taking a position.
How to trade descending channel?
1. Breakout to the upside
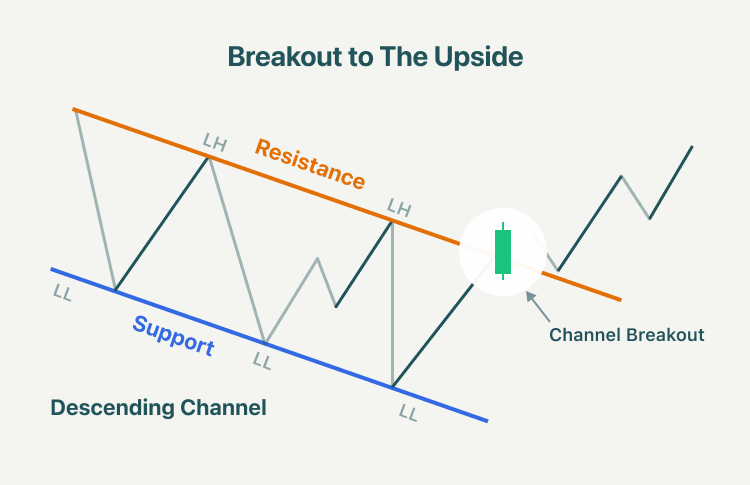
A breakout to the upside means there is a possible shift from a bearish sentiment to a bullish. This strategy will have you buying the break above the channel. It’s recommended that buying into this break should occur after multiple tests of the upper channel line.
2. Breakout to the downside
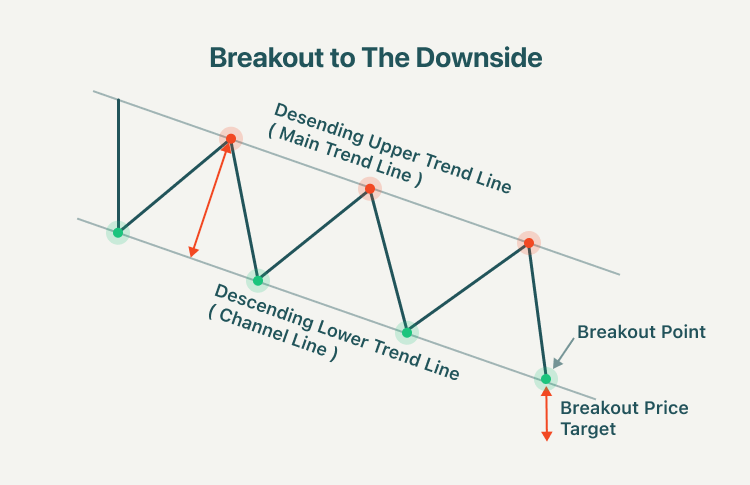
The breakout to the downside is again often overlooked as a method for trading this setup. A break below the lower trend channel line is a signal that the stock is experiencing significant weakness. This likely means the channel is now expanding and there will be a new lower channel line. Thus, traders can place a sell order when the price breaks out of the lower trend line.
3. Support and resistance
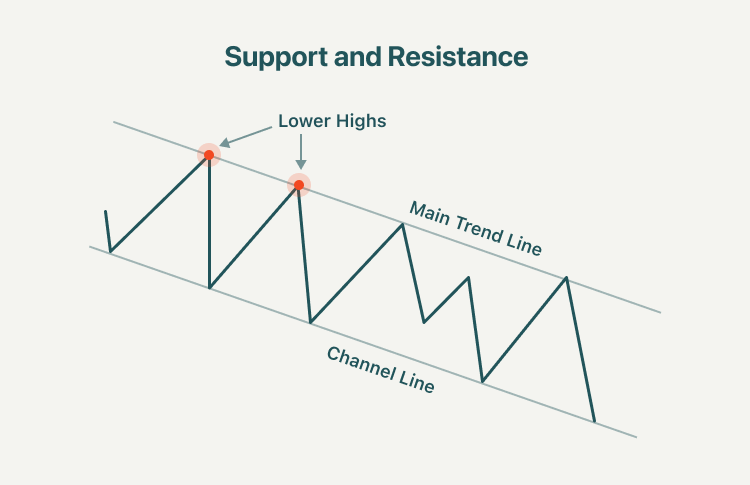
When an asset price is around the upper trend line, look for short opportunities, although aggressive traders could trade long and/or short at both trend lines looking for a bounce or pullback. When the price breaks through the resistance line, it might indicate a significant change in trend. Breaking through the lower line, in contrast, suggests an acceleration of the existing trend.
Summary:
- An ascending channel is the price action contained between upward-sloping parallel lines. Higher highs and higher lows characterize this price pattern. Ascending channels are used commonly to confirm trends and identify breakouts and reversals.
- In an ascending channel, a breakout above the upper trendline generates a strong buy signal, while a breakdown below the lower trendline generates a strong sell signal.
- A descending channel is drawn by connecting the lower highs and lower lows of a security's price with parallel trendlines to show a downward trend.
- When the price of an ascending channel breaks below the lower channel line (support), it is a sign of pattern weakness. Here, traders may enter a short position on the asset.
- When an asset's price rises over the top of an ascending channel, traders may decide to place a buy order. It is wise to utilize additional technical tools to verify the breakout, such as traders may wait for the breakthrough to be accompanied by a big increase in volume.
- In a descending channel, a breakout to the upside means there is a possible shift from a bearish sentiment to a bullish. This strategy will have you buying the break above the channel.
- A break below the lower trend channel line is a signal that the stock is experiencing significant weakness. This likely means the channel is now expanding and there will be a new lower channel line.
- When an asset price is around the upper trend line, look for short opportunities, although aggressive traders could trade long and/or short at both trend lines looking for a bounce or pullback.


