What are Bollinger Bands?
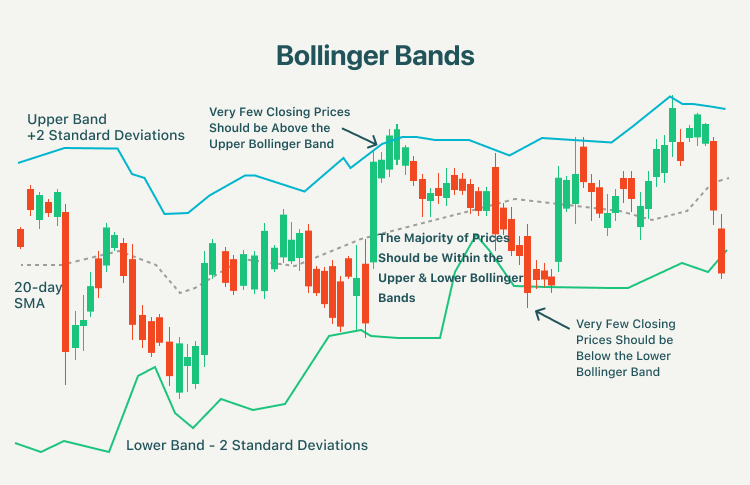
Bollinger Bands were developed and copyrighted by the famous technical trader John Bollinger, designed to discover opportunities that give investors a higher probability of properly identifying when an asset is oversold or overbought. The indicator is defined by a set of trendlines plotting two standard deviations (positively and negatively) away from a simple moving average (SMA) of an asset's price. Three lines compose Bollinger Bands:
- Moving Average: By default, a 20-period simple moving average is used.
- Upper Band: The upper band is usually 2 standard deviations (calculated from 20 periods of closing data) above the moving average.
- Lower Band: The lower band is usually 2 standard deviations below the moving average.

Bollinger Bands help determine whether prices are high or low on a relative basis. They are used in pairs, including upper and lower bands, and in conjunction with a moving average. Further, the pair of bands is not intended to be used on its own. Use the pair to confirm signals given with other indicators.
Bollinger Bands trading strategies
1. Breakouts
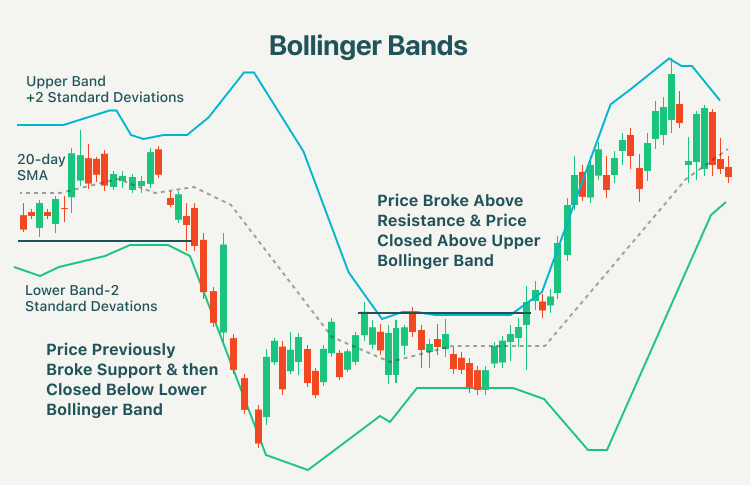
Breakouts occur after a period of consolidation when the price closes outside of the Bollinger Bands. The highs and lows of consolidation may be marked with trend lines. A price move above the high of the consolidation would be considered an upside breakout, while a price close below the low of the consolidation would be considered a downside breakout.

Other indicators such as support and resistance lines might prove beneficial when a trader decides whether or not to buy or sell in the direction of the breakout.
- Potential buy signal: A trader might buy when the price breaks above the upper Bollinger Band after a period of price consolidation.
- Potential sell signal: A trader might sell when the price breaks below the lower Bollinger Band. A trader might use other confirming indicators as well, such as a broken support line.
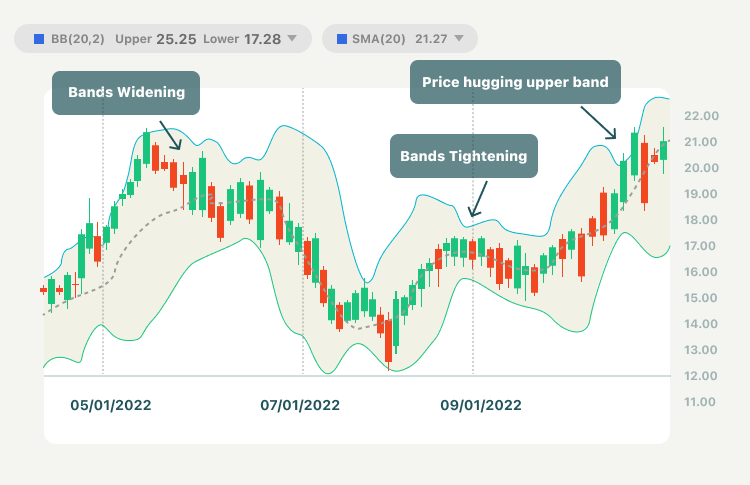
Moreover, it is also preferable to see the upper and lower band starting to widen in a breakout scenario. The widening of the bands suggests an increase in volatility to confirm the move out of consolidation and into a new trend.
2. Bollinger Bands showing a strong trend
A strong trend continuation can be expected when the price moves out of the bands. However, if prices move immediately back inside the band, then the suggested strength is negated.

3. Price swings
Prices tend to bounce within the bands' envelope, touching one band and then moving to the other band. You can use these swings to help identify potential profit targets. For example, if a price bounces off the lower band and then crosses above the moving average, the upper band then becomes the profit target.
Summary:
- Bollinger Bands were developed and copyrighted by the famous technical trader John Bollinger, designed to discover opportunities that give investors a higher probability of properly identifying when an asset is oversold or overbought.
- Three lines compose Bollinger Bands: Moving Average, upper band, and lower band.
- A price move above the high of the consolidation would be considered an upside breakout, while a price close below the low of the consolidation would be considered a downside breakout.
- A trader might buy when the price breaks above the upper Bollinger Band after a period of price consolidation while he/she might sell when the price breaks below the lower Bollinger Band. A trader might use other confirming indicators as well, such as a broken support line.
- A strong trend continuation can be expected when the price moves out of the bands. However, if prices move immediately back inside the band, then the suggested strength is negated.
- Prices tend to bounce within the band's envelope, touching one band and then moving to the other band. You can use these swings to help identify potential profit targets.


