
Saudi Market
TASI Technical Analysis:
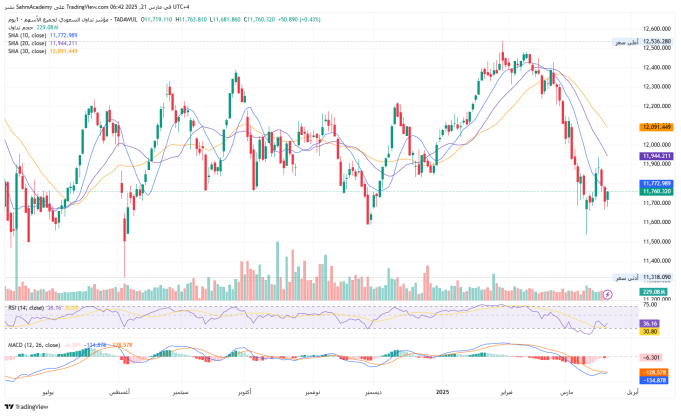
The Tadawul Index is at 11,760.320 points, showing a potential bottoming pattern with recent green candles indicating buying interest. All MAs (10-day: 11,772.989; 20-day: 11,944.211; 30-day: 12,091.449) are sloping downward, and the current price is below them, suggesting a bearish market. However, the price is near the 10-day MA, hinting at a possible recovery. The RSI (36.16) is close to oversold conditions, and its divergence with the signal line (30.80) suggests a potential bullish reversal. The MACD indicates bearish momentum (-128.578 and -134.878), but the bearish pressure is weakening (histogram: -6.301). In the short term, the market is cautiously bullish due to the RSI nearing oversold levels. In the medium term, the downward MAs suggest ongoing pressure, and the index must break through all major MAs to confirm a trend reversal. The buy trigger is a sustained break above 11,800 with rising volume, the stop-loss is below 11,500, and take-profit targets are 11,950, 12,100, and 12,300.
TASI Index Weekly Market Summary (March 16 to March 21)
The Saudi stock market TASI index fell 0.79% this week, closing at around 11,760 points, and the overall market performance was weak. Despite the decline in the index, the market trading activity was high. The average daily turnover of 5.3 billion Saudi riyals and a total turnover of 26.5 billion Saudi riyals, indicating a high level of market participation.
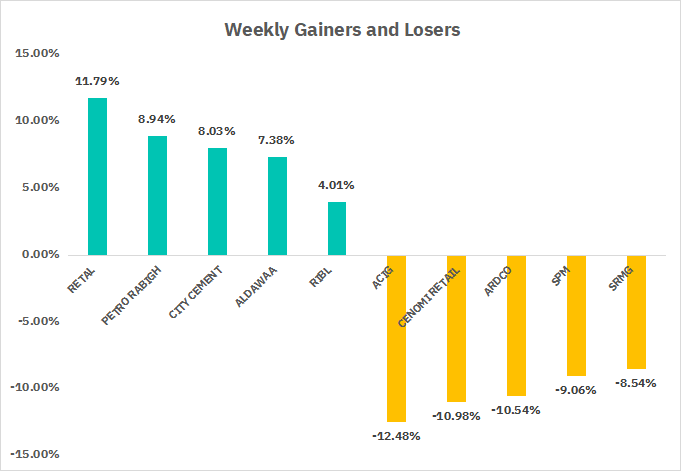
From the perspective of individual stock performance, 55 companies saw their stock prices rise this week, while 212 companies saw their stock prices fall. The companies with the highest increase included RETAL, PETRABIGH, CITYCEMENT, with increases of 11.79%, 8.94%, and 8.03% respectively. The companies with the highest decline included ACIG, CENOMI RETAIL, ARDCO, with declines of 12.48%, 10.98%, and 10.54% respectively.
Overall, the Saudi stock market performed poorly this week, and investors may be cautious about geopolitics and Trump's tariff policy.
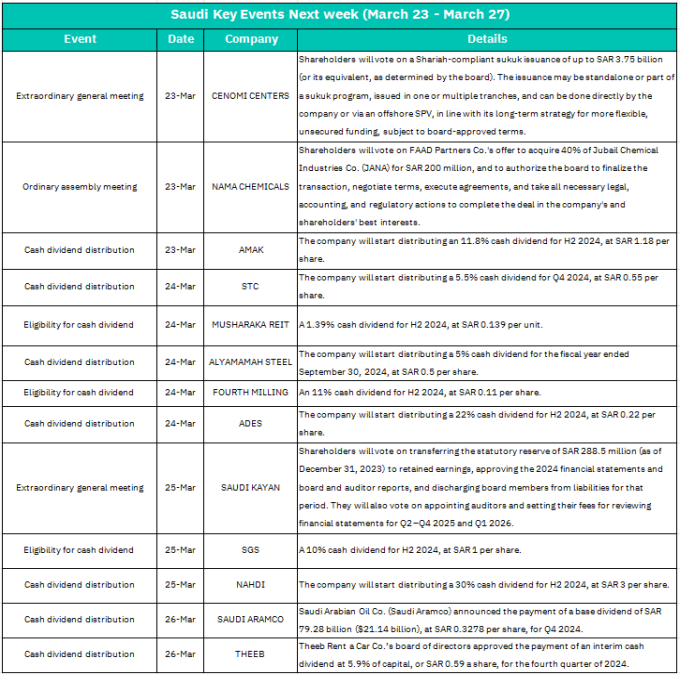
1.March 23-Cenomi Centers (Extraordinary General Meeting)
Shareholders vote on a Sukuk issuance of up to SAR 3.75 billion.Approval could enhance liquidity and flexibility for long-term projects, signaling growth ambitions. However, increased debt might pressure short-term financial ratios. Positive sentiment if structured efficiently via SPV offshore.
-NAMA Chemicals (Ordinary Assembly Meeting)
Vote on FAAD Partners’ 40% acquisition of JANA for SAR 200 million.
Strategic expansion into Dubai’s chemical sector could boost revenue diversification. Shareholder approval may lift short-term stock price due to growth prospects.
-AMAK (Cash Dividend Distribution)
Dividend: 12.8% (SAR 1.18/share) for H2 2024.
High yield (12.8%) attracts income-focused investors, likely driving pre-dividend buying. Post-payout, short-term profit-taking possible.
2.March 24 - STC ( Distribution)
Dividend: 6.5% (SAR 0.58/share) for Q4 2024.
Moderate yield aligns with STC’s stable telecom cash flows. Limited price volatility expected, but reinforces investor confidence in blue-chip stocks.
-MUSHARAKA REIT (Eligibility for Dividend)
Dividend: 1.39% (SAR 0.139/unit) for H2 2024.
Low yield may disappoint REIT investors, potentially triggering minor sell-offs. Focus shifts to sector performance (e.g., real estate demand).
-ALYAMAMAH STEEL & FOURTH MILLING (Dividends)
Dividends: 5% (SAR 0.5/share) and 11% (SAR 0.11/share), respectively.
Mixed signals—ALYAMAMAH’s modest payout reflects sector challenges (steel demand), while FOURTH MILLING’s higher yield (11%) may support stock demand.
-ADES (Cash Dividend)
Dividend: 22% (SAR 0.22/share) for H2 2024.
Exceptionally high yield (22%) suggests strong earnings, likely attracting speculative interest. Short-term rally possible, but sustainability concerns may arise later.
3.March 25 - Saudi Kayan (Extraordinary General Meeting)
Transfer SAR 288.5m statutory reserve to retained earnings; approve 2024 financials.
Impact: Reserve reallocation signals confidence in profitability, potentially freeing capital for future dividends or investments. Auditor appointments may improve governance credibility.
-SGS & NAHDI (Dividends)
Dividends: SGS (10%, SAR 1/share) and NAHDI (30%, SAR 3/share).
NAHDI’s massive 30% payout could trigger a surge in retail investor activity. SGS’s 10% yield supports mid-cap appeal.
4.March 26 - Saudi Aramco (Cash Dividend)
Dividend: Base payout of SAR 79.28bn ($21.14bn), SAR 0.3278/share for Q4 2024.
Aramco’s colossal dividend reinforces its role as a market stabilizer. Investors may rotate into Aramco for safety, buoying the Tadawul index.
-THEEB (Interim Dividend)
Dividend: 5.9% (SAR 0.59/share) for Q4 2024.
Moderate payout aligns with THEEB’s recovery in travel/rental demand. Positive sentiment for small-cap consumer stocks.
U.S. Market
S&P500 Technical Analysis:
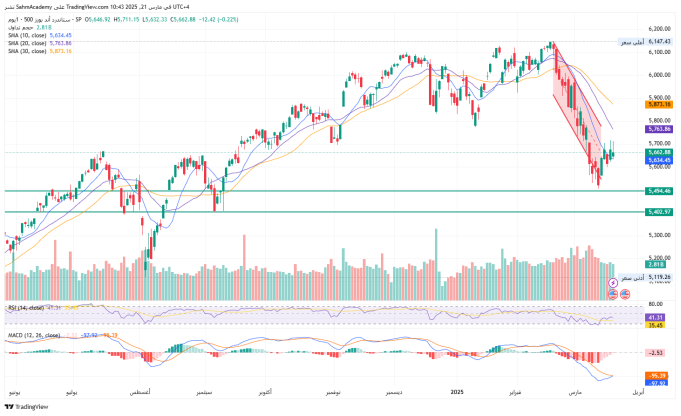
The SP500 index, currently at 5,662.88, is showing signs of recovery after a sharp downtrend, forming a potential double bottom around 5,500. The moving averages (10-day: 5,634.45; 20-day: 5,763.86; 30-day: 5,873.16) are in bearish alignment but the price has crossed above the 10-day SMA. The RSI (41.31) is recovering from oversold conditions with a positive divergence, and the MACD shows weakening bearish momentum. Key support levels are at 5,634.45, 5,494.46, and 5,402.97, while resistance levels are at 5,763.86, 5,873.16, and 6,000. Short-term outlook is cautiously bullish with a target at 5,763. Trading levels suggest entry at current price, stop-loss below 5,500, and take-profit targets at 5,763, 5,873, and 6,000.
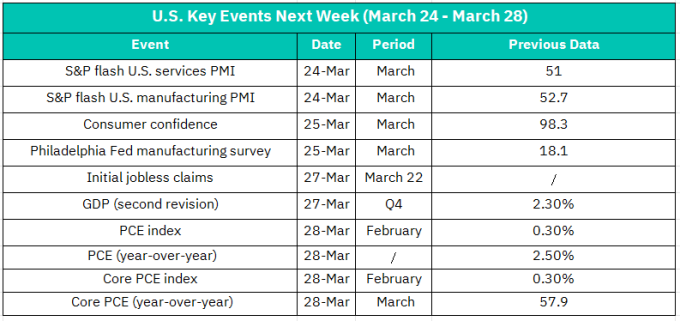
1.March 24– S&P Flash U.S. Services PMI (March)
The previous reading of 51 indicates marginal expansion. A higher figure could signal stronger service-sector activity, supporting optimism about economic resilience. A drop below 50 might raise concerns about slowing demand.
– S&P Flash U.S. Manufacturing PMI (March)
The prior 52.7 suggests moderate growth. A decline could weigh on industrial and cyclical stocks, while an improvement might reinforce confidence in manufacturing recovery.
2. March 25 – Consumer Confidence (March)
After February’s 98.3, a rise would signal stronger household spending intentions, potentially boosting retail and discretionary sectors. A dip could hint at caution amid inflation or labor market uncertainties.
– Philadelphia Fed Manufacturing Survey (March)
The previous 18.1 reflects regional factory expansion. A weaker result may dampen sentiment toward broader manufacturing health, impacting industrial equities.
3. March 27 – Initial Jobless Claims (March 22)
As a real-time labor market gauge, lower claims would reinforce strength in employment, supporting risk assets. A surprise increase might revive recession fears.
– GDP (Q4 Second Revision)
The prior 2.30% growth rate is unlikely to see major revisions, but upward adjustments could lift growth expectations, while downward tweaks might highlight late-2023 softness.
4.March 28 – PCE Index and Core PCE (February)
The Fed’s preferred inflation metrics. A monthly rise above 0.30% (previous) could reignite rate-hike anxieties, pressuring equities and bonds. Conversely, softer figures might fuel rate-cut hopes.
–Core PCE Year-over-Year (March)
The prior 2.50% is near the Fed’s target. Sticky inflation here would challenge dovish policy bets, while a drop could ease Treasury yields and boost tech/growth stocks.If the LEI remains stable or improves, it could ease market concerns and lift risk appetite.
Crypto ETF Technical Analysis:
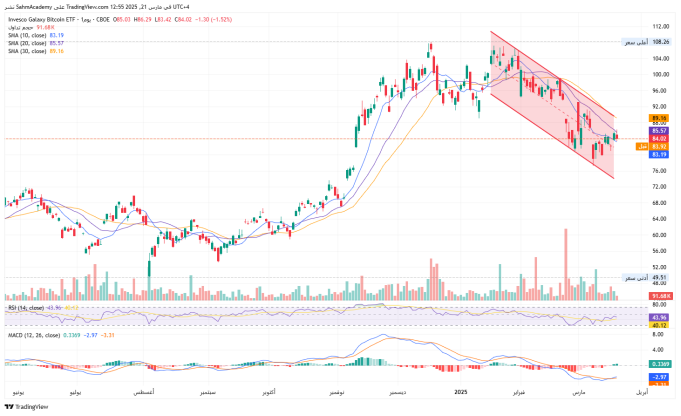
The Invesco Galaxy Bitcoin ETF is currently at $84.02, within a bearish channel that began in January 2025. The price is above the 10-day SMA ($83.19) but below the 20-day ($85.57) and 30-day SMAs ($89.16). The RSI (43.96) is improving, and the MACD shows a bullish crossover, suggesting potential short-term bullish momentum. Support levels are at $83.19, $80-82, and $76, while resistance is at $85.57, $89.16, and $90. Short-term outlook is neutral with a slight bullish bias, targeting $85.57. Medium-term remains bearish unless the ETF breaks above the channel and 30-day SMA.
Disclaimer:
Sahm is subject to the supervision and control of the CMA, pursuant to its license no. 22251-25 issued by CMA.
The Information presented above is for information purposes only, which shall not be intended as and does not constitute an offer to sell or solicitation for an offer to buy any securities or financial instrument or any advice or recommendation with respect to such securities or other financial instruments or investments. When making a decision about your investments, you should seek the advice of a professional financial adviser and carefully consider whether such investments are suitable for you in light of your own experience, financial position and investment objectives. The firm and its analysts do not have any material interests or conflicts of interest in any companies mentioned in this report.
Performance data provided is accurate and sourced from reliable platforms, including Argaam, TradingView, MarketWatch.
IN NO EVENT SHALL SAHM CAPITAL FINANCIAL COMPANY BE LIABLE FOR ANY DAMAGES, LOSSES OR LIABILITIES INCLUDING WITHOUT LIMITATION, DIRECT OR INDIRECT, SPECIAL, INCIDENTAL, CONSEQUENTIAL DAMAGES, LOSSES OR LIABILITIES, IN CONNECTION WITH YOUR RELIANCE ON OR USE OR INABILITY TO USE THE INFORMATION PRESENTED ABOVE, EVEN IF YOU ADVISE US OF THE POSSIBILITY OF SUCH DAMAGES, LOSSES OR EXPENSES.
