Exciting news! Sahm Research Center is launching a new Weekly Report section, and we want your input! Help us shape our content by taking a quick survey: Join the Survey
Your feedback is essential in creating a tailored experience just for you. Thank you for being part of our community!
Weekly Report (December 22 – December 26)
Saudi Market

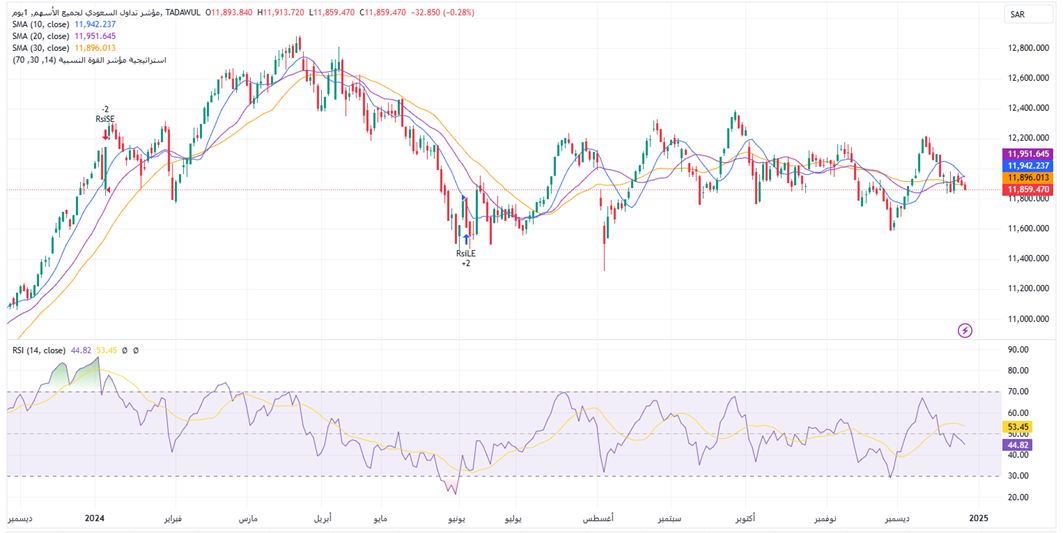
TASI Technical Analysis:
The 10-day SMA (blue line) has recently shown signs of crossing below the 20-day and 30-day SMAs, which could be a short-term bearish sign.
The 20-day SMA (purple line) and 30-day SMA (yellow line) have recently shown signs of flattening, suggesting that the market may be searching for direction in the medium term.
The 30-day SMA is slightly declining. Although it is currently above the 20-day SMA, it shows a tendency to cross downward, indicating that the long-term trend of the market is negative.
The RSI has recently fluctuated around 50, indicating that the market is in a neutral state.

TASI Index Weekly Market Summary (December 22, 2024, to December 26, 2024)
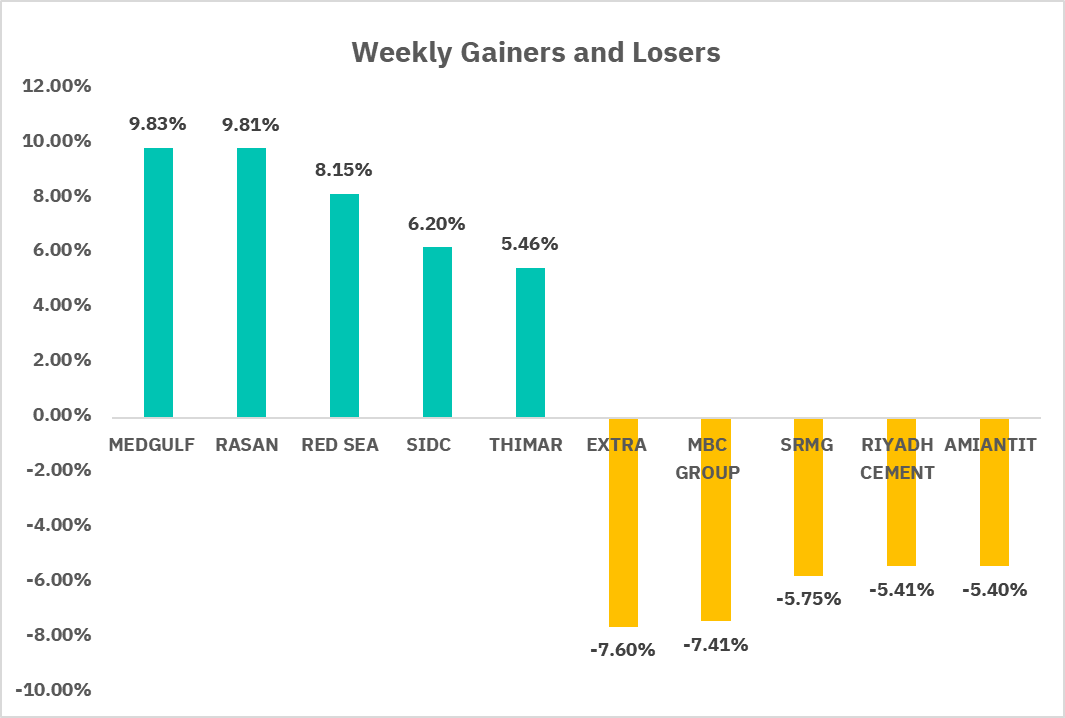
The market exhibited stable performance last week, with the TASI index increasing by 0.09%. The index closed at 11,849.37 on Sunday and reached its weekly peak of 11,948.79 on Monday. In terms of individual stock performance, 107 companies saw their share prices rise, while 143 companies experienced declines. MEDGULF and RASAN were the top gainers, with gains of 9.83% and 8.81%. Conversely, EXTRA and MBC GROUP were the worst losers, with declines of 7.60% and 7.41%.

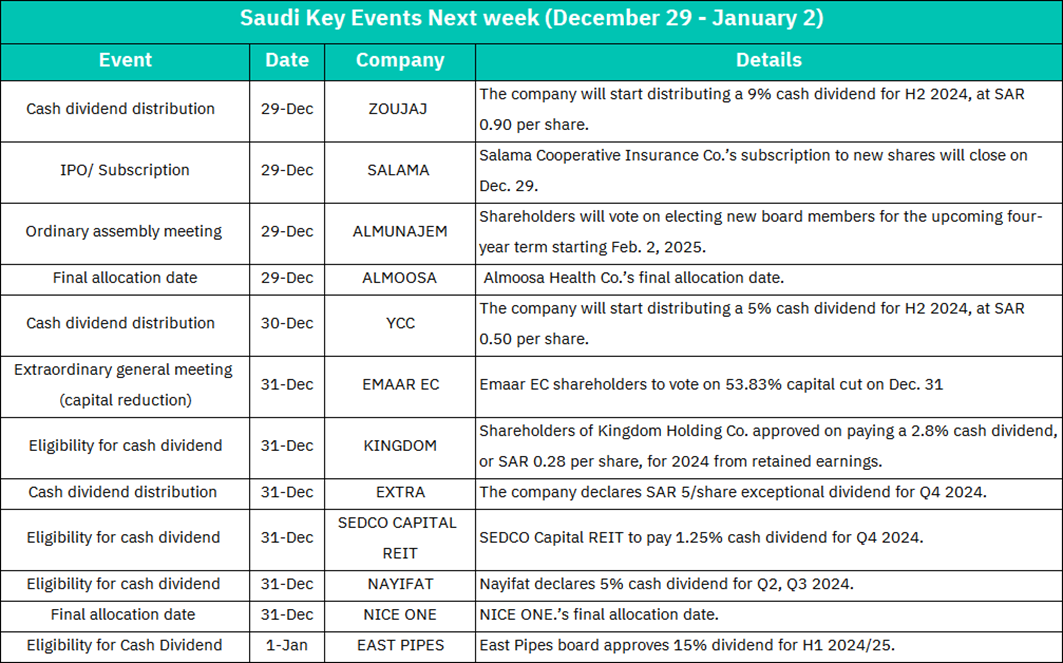
1. December 29: ZOUJAJ will start distributing 9% cash dividends in the second half of 2024, 0.90 Saudi riyals per share. Subscriptions for new shares in Salama Cooperative Insurance Co. will close on December 29. ALMUNAJEM will hold a shareholders' meeting to elect new board members for a four-year term starting on February 2, 2025. Final distribution date for Almoosa Health Co.
2. December 30: Yanbu Cement Co.’s board of directors declared a 5% cash dividend at SAR 0.5 per share for the second half of 2024.
3. December 31: EMAAR EC will hold an Extraordinary General Meeting of Shareholders, where shareholders will vote on a 53.83% capital reduction. Kingdom Holding Co. shareholders have approved the payment of a 2.8% cash dividend of 0.28 SAR per share for 2024 from retained earnings. EXTRA Company declares a special dividend of 5 SAR per share for the fourth quarter of 2024. SEDCO Capital REIT to pay a 1.25% cash dividend (SAR 0.125 per unit) for the fourth quarter of 2024. Nayifat declares a 5% cash dividend, or SAR 0.5 per share, for the second and third quarters of 2024. NICE ONE’s final distribution date.
4. January 1: The East Pipes board approved a 15% cash dividend, or SAR 1.5 per share, for the first half of 2024/25.
U.S. Market

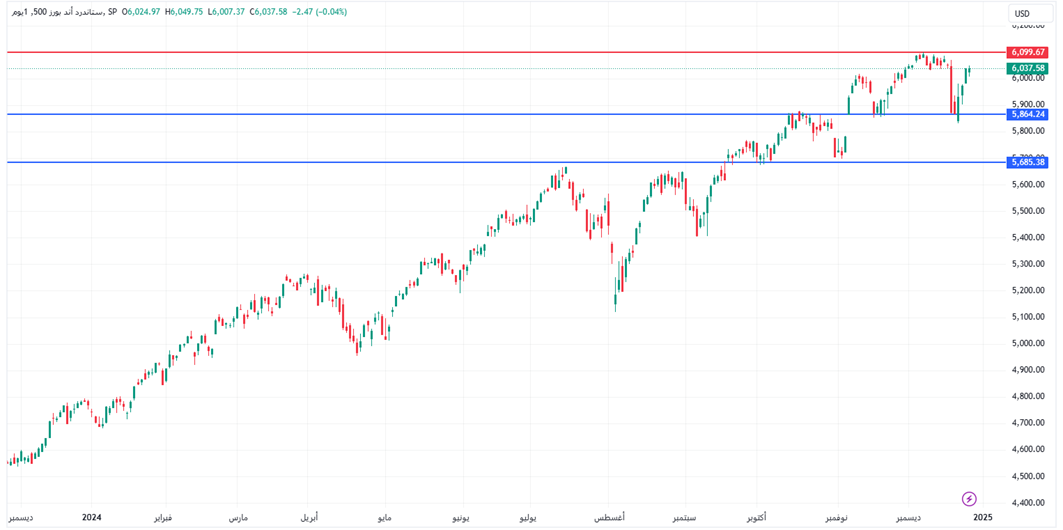
S&P500 Technical Analysis:
The S&P 500 increased by 1.80%, The S&P 500 index started to rebound after reaching the support level of $5,864. If it can break through the resistance level of $6,099, the S&P 500 will set a new high.
The U.S. stock market was also in the traditional seasonal favorable phase of the "Santa Claus rally" last week. The "Santa Claus rally" refers to the last five trading days of each year (usually starting around Christmas) and the first two trading days of the next year.
Over the past 70 years, the S&P 500 has averaged a gain of about 1.3% during these seven trading days, with a 78% chance of a positive move during this period. The market's strength during this period may be partly attributed to low liquidity, tax-loss harvesting, and year-end bonus investments.

1. Chicago Business Barometer (PMI): The December data will provide insights into manufacturing activity in the Midwest on December 30. The previous reading was 40.2, which indicated a contraction in manufacturing activity. If the new data shows improvement, it could have a positive impact on market sentiment.
2. Official Holiday: The stock market is closed on January and investors may adjust their portfolios before the holiday.
3. Initial Jobless claims: Data on Dec. 28 will provide insight into labor market conditions. If the number of claims decreases, it could indicate stabilization or improvement in the job market.
4. ISM Manufacturing Index: The previous value of the December data was 48.4%. An index above 50% indicates expansion in the manufacturing industry, while a value below 50% indicates contraction. If the new data is close to or above 50%, it may indicate stability or growth in the manufacturing industry, which is a positive signal for the stock market.
Disclaimer:
Sahm is subject to the supervision and control of the CMA, pursuant to its license no. 22251-25 issued by CMA.
The Information presented above is for information purposes only, which shall not be intended as and does not constitute an offer to sell or solicitation for an offer to buy any securities or financial instrument or any advice or recommendation with respect to such securities or other financial instruments or investments. When making a decision about your investments, you should seek the advice of a professional financial adviser and carefully consider whether such investments are suitable for you in light of your own experience, financial position and investment objectives. The firm and its analysts do not have any material interests or conflicts of interest in any companies mentioned in this report.
Performance data provided is accurate and sourced from reliable platforms, including Argaam, TradingView, MarketWatch.
IN NO EVENT SHALL SAHM CAPITAL FINANCIAL COMPANY BE LIABLE FOR ANY DAMAGES, LOSSES OR LIABILITIES INCLUDING WITHOUT LIMITATION, DIRECT OR INDIRECT, SPECIAL, INCIDENTAL, CONSEQUENTIAL DAMAGES, LOSSES OR LIABILITIES, IN CONNECTION WITH YOUR RELIANCE ON OR USE OR INABILITY TO USE THE INFORMATION PRESENTED ABOVE, EVEN IF YOU ADVISE US OF THE POSSIBILITY OF SUCH DAMAGES, LOSSES OR EXPENSES.


