
Saudi Market
TASI Technical Analysis:
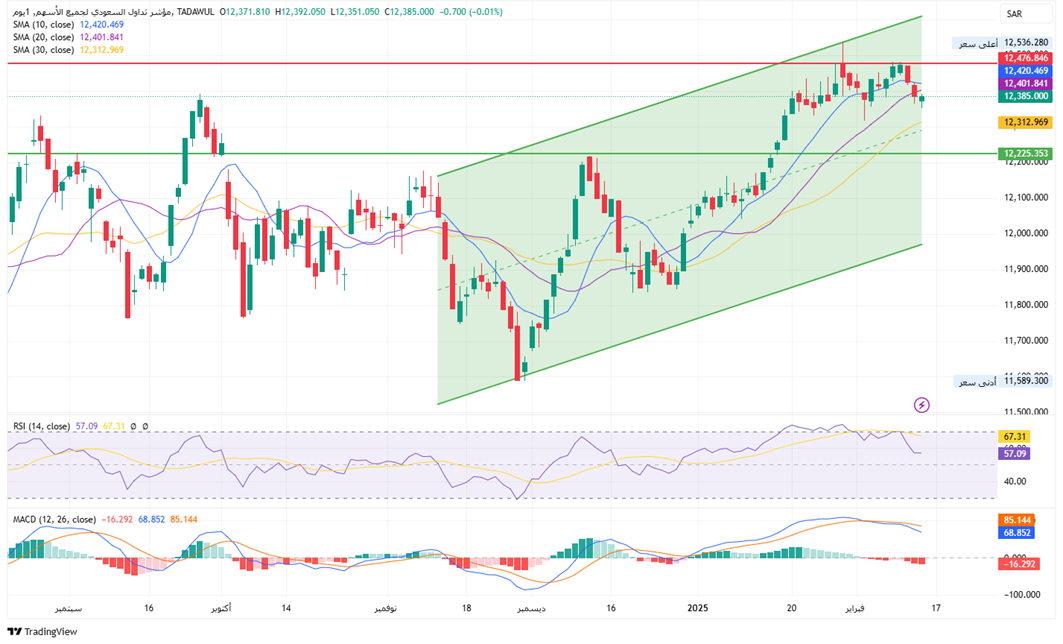
The TADAWUL Index has been trending higher within an ascending channel (highlighted in green), reflecting a continued bullish bias. Recently, the index encountered resistance near the channel’s upper boundary at 12,476 points, leading to a brief pullback. If the market manages to hold around the channel’s midpoint, there is a strong likelihood of another attempt to test the upper boundary.
The RSI is currently at 57.09, which is in the neutral territory. This indicates that the market is neither overbought nor oversold. However, the RSI has been trending upwards, suggesting that the bullish momentum is still intact.
The MACD indicating bullish momentum. However, the histogram has been showing some signs of weakening, which could suggest a potential short-term correction.
TASI Index Weekly Market Summary (February 9 to February 13)
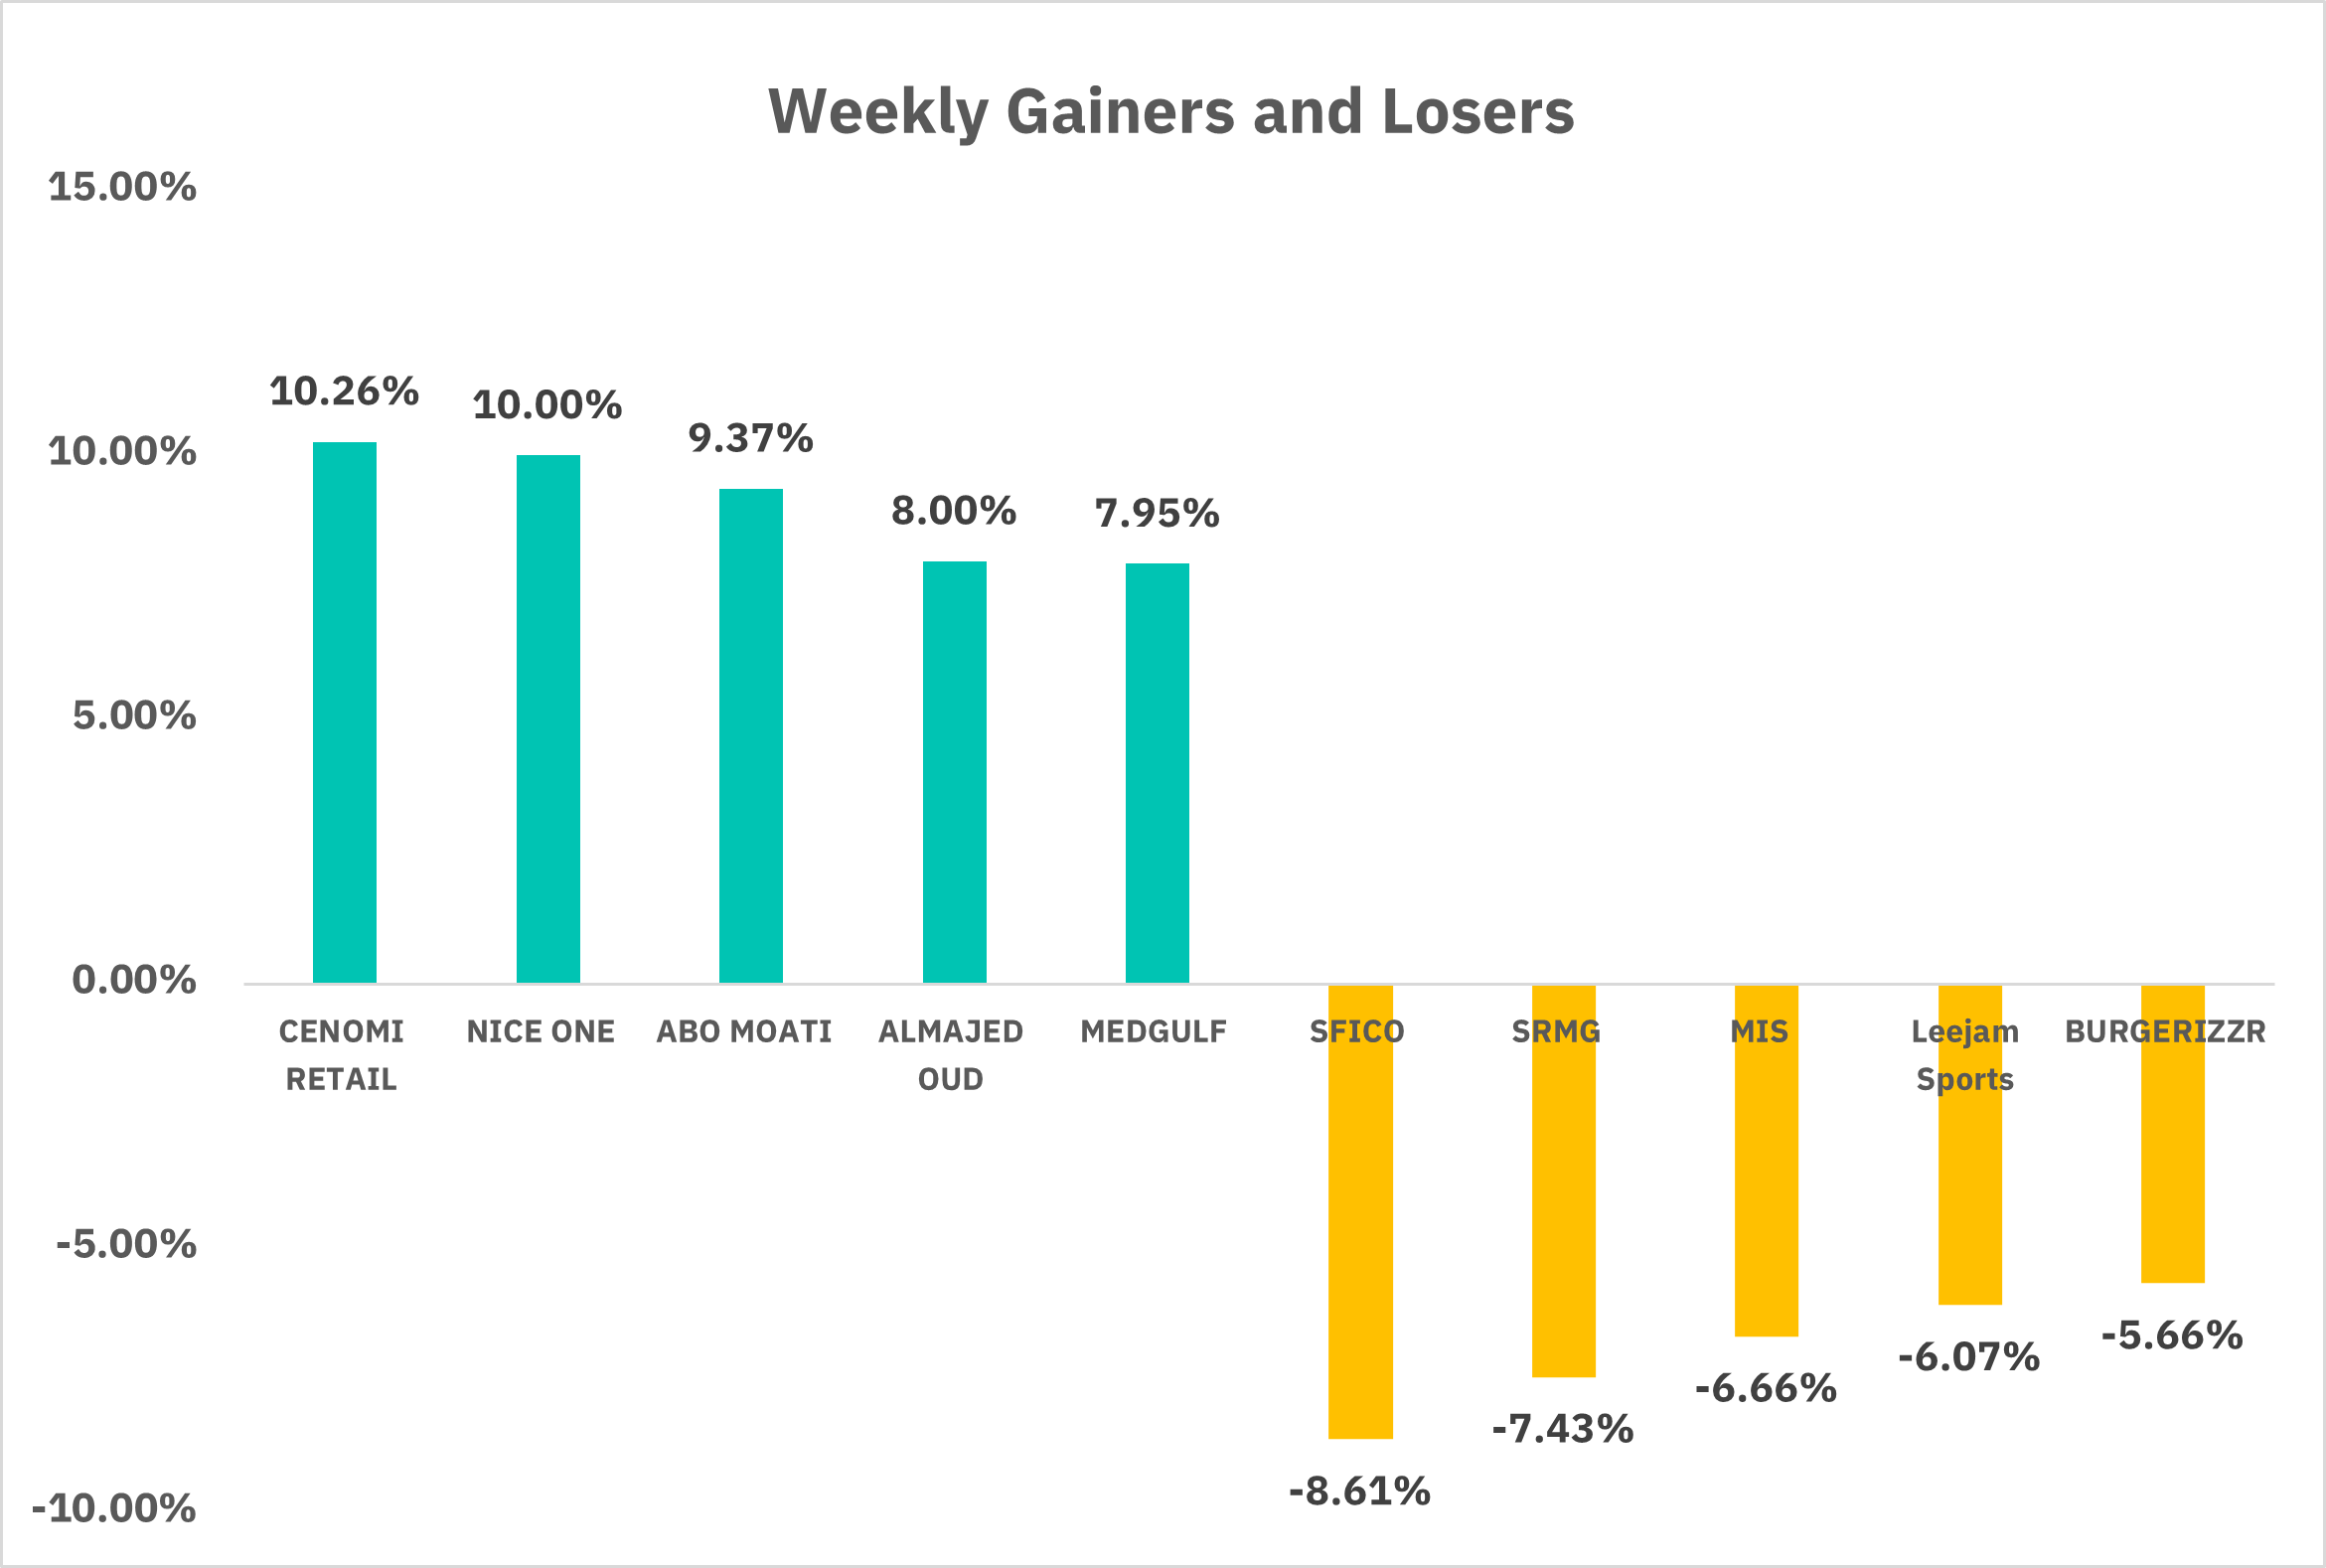
Over the past week, the TASI exhibited a slight downward trend, with the index declining by 0.67%. The average daily turnover stood at SAR 5,527 million, with a total turnover of SAR 27,639 million over the five trading days. In terms of market performance, there were 62 gainers and 198 losers. Notable gainers included CENOMI RETAIL, which saw a 10.26% increase, and NICE ONE, which rose by 10.00%. On the flip side, significant losers included SFICO, which declined by 8.61%, and SRMG, which dropped by 7.43%. Overall, the market experienced a moderate decline, with certain companies showing notable gains while others faced substantial losses.
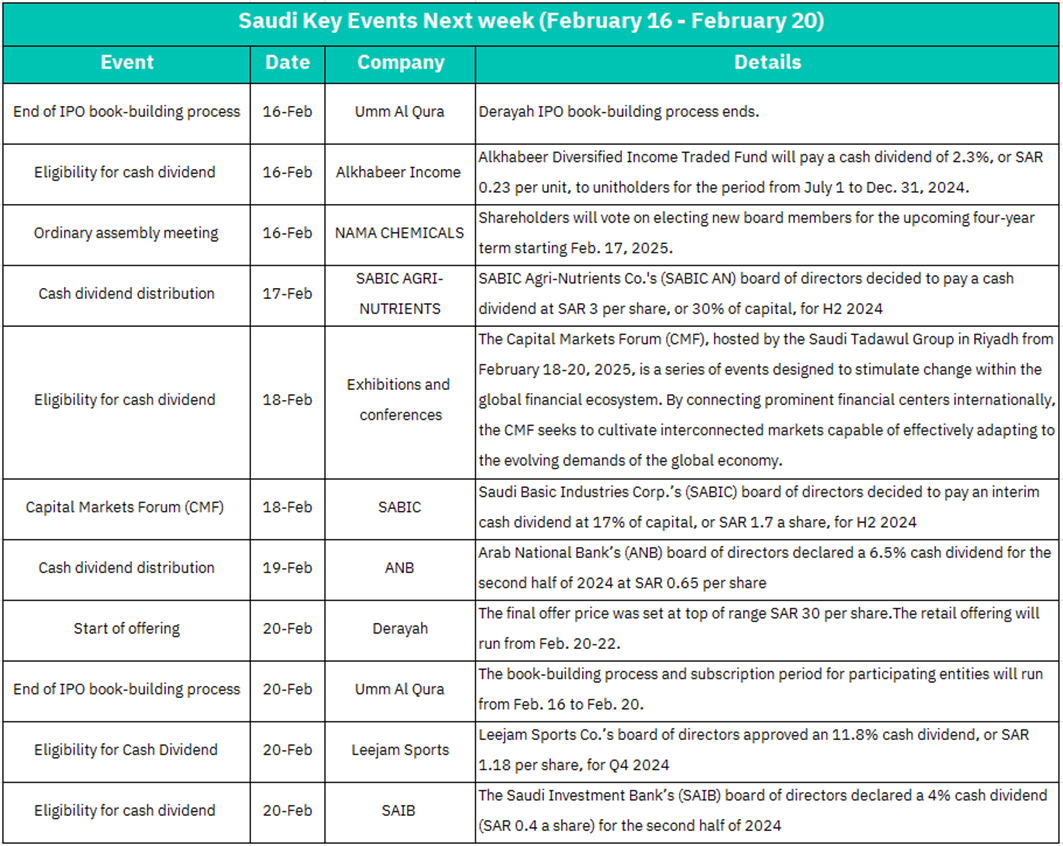
1. February 16: The IPO book-building process for Umm Al Qura will conclude on February 16. This marks the end of the institutional placement phase, and the final offer price is expected to be announced shortly thereafter. The conclusion of the book-building process is a critical step toward the company's listing on the stock exchange, which could positively impact investor sentiment and potentially drive up the stock price upon listing.
Alkhabeer Diversified Income Traded Fund will pay a cash dividend of 2.3%, or SAR 0.23 per unit, to unitholders for the period from July 1 to December 31, 2024. This dividend payment is likely to be well-received by investors, as it reflects the fund's strong financial performance and commitment to returning value to shareholders. The announcement of the dividend may also have a positive impact on the fund's unit price.
NAMA CHEMICALS will hold an ordinary assembly meeting on February 16, where shareholders will vote on electing new board members for the upcoming four-year term starting February 17, 2025. The election of new board members could bring fresh perspectives and strategic direction to the company, which may be viewed positively by investors. However, any uncertainty surrounding the new board's plans could lead to short-term volatility in the stock price.
2. February 17: SABIC Agri-Nutrients Co. (SABIC AN) will pay a cash dividend of SAR 3 per share, or 30% of capital, for H2 2024. This significant dividend payout demonstrates the company's strong financial health and commitment to shareholder returns. The dividend distribution is likely to be well-received by investors and may provide support to the stock price.
3. February 18: The Capital Markets Forum (CMF), hosted by the Saudi Tadawul Group in Riyadh from February 18-20, 2025, is a series of events designed to stimulate change within the global financial ecosystem. The CMF aims to connect prominent financial centers internationally and cultivate interconnected markets capable of adapting to the evolving demands of the global economy. The event is likely to attract significant attention from investors and market participants, potentially increasing trading activity and market liquidity during this period.
SABIC's board of directors decided to pay an interim cash dividend at 17% of capital, or SAR 1.7 per share, for H2 2024. This dividend announcement, coinciding with the CMF, highlights SABIC's strong financial performance and commitment to shareholder returns. The dividend is likely to be well-received by investors and may positively impact the stock price.
4. February 19: Arab National Bank (ANB) will pay a 6.5% cash dividend for the second half of 2024 at SAR 0.65 per share. This dividend payout reflects ANB's solid financial performance and commitment to returning value to shareholders. The dividend distribution is likely to be positively received by investors and may provide support to the stock price.
5. February 20: The final offer price for Derayah's IPO was set at SAR 30 per share, with the retail offering running from February 20-22. The start of the retail offering is a significant milestone in the IPO process and could generate significant investor interest. Strong demand during the retail offering phase may indicate positive market sentiment toward the company and could lead to a higher stock price upon listing.
The book-building process and subscription period for participating entities in Umm Al Qura's IPO will run from February 16 to February 20. The conclusion of the book-building process marks the end of the institutional placement phase, and the final offer price is expected to be announced shortly thereafter. The end of the book-building process is a critical step toward the company's listing on the stock exchange, which could positively impact investor sentiment and potentially drive up the stock price upon listing.
Leejam Sports Co.'s board of directors approved an 11.8% cash dividend, or SAR 1.18 per share, for Q4 2024. This significant dividend payout demonstrates the company's strong financial health and commitment to shareholder returns. The dividend announcement is likely to be well-received by investors and may positively impact the stock price.
The Saudi Investment Bank (SAIB) will pay a 4% cash dividend (SAR 0.4 per share) for the second half of 2024. This dividend payout reflects SAIB's solid financial performance and commitment to returning value to shareholders. The dividend distribution is likely to be positively received by investors and may provide support to the stock price.
U.S. Market
S&P500 Technical Analysis:
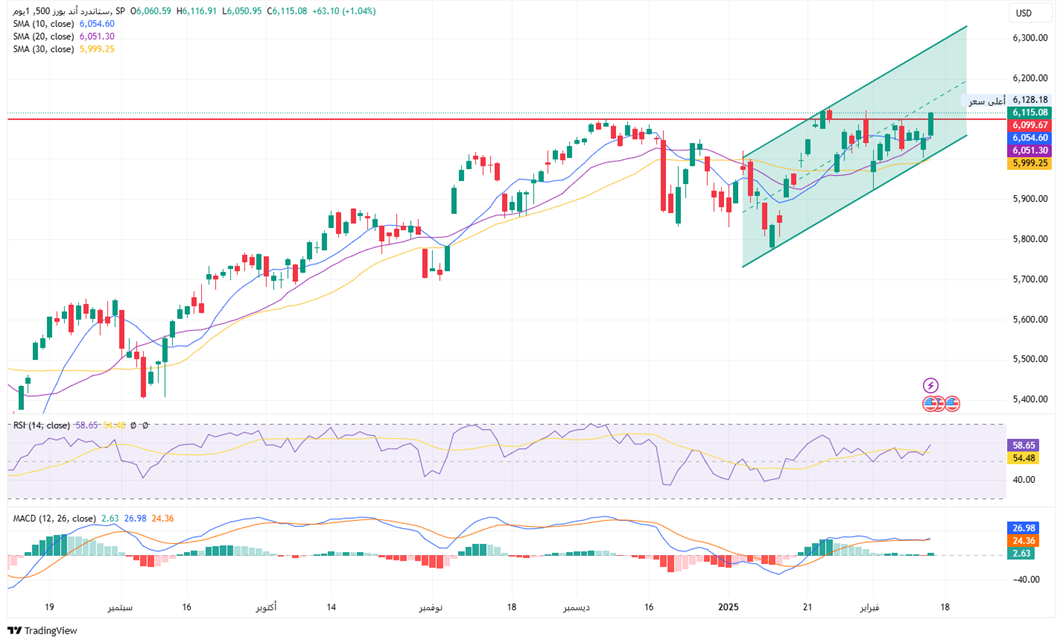
Over the past week, the S&P 500 climbed 1.48%, breaking above the 6099 resistance level. The index is currently moving within an ascending channel, with the channel’s lower and upper boundaries serving as short-term support and resistance, respectively.
The RSI is hovering around 55, remaining above the 50 midpoints but below the 70 overbought thresholds, indicating that the market is not overheated in the short term and still has room to advance. If the RSI continues to rise into the 60–70 range and price action breaks above resistance, it often signals an acceleration of the uptrend or a continuation of the rally.
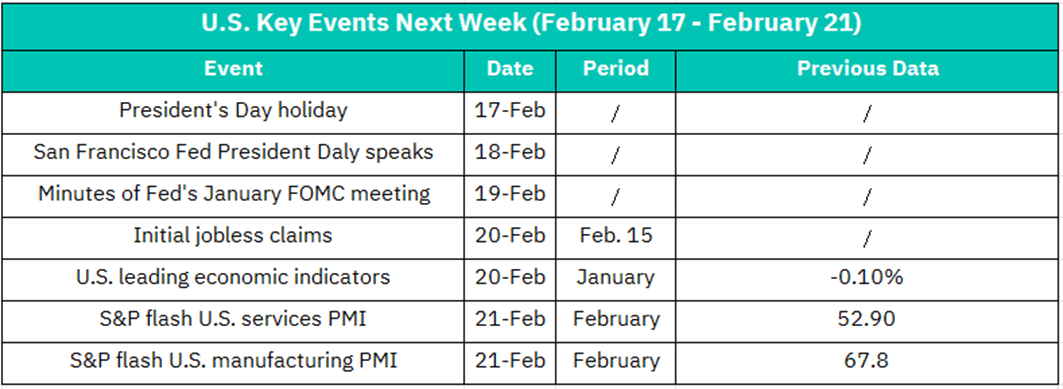
1. February 17 – Presidents' Day Holiday
U.S. equity markets will be closed in observance of Presidents' Day, resulting in a trading halt and significantly diminished market liquidity. The final trading day prior to the holiday (February 16) may witness position liquidations or hedging maneuvers; however, overall volatility is expected to decline as the holiday approaches.
2. February 18 – Speech by San Francisco Fed President Mary Daly
Mary Daly’s address is anticipated to cover the U.S. economic outlook, inflation, and monetary policy. If she delivers dovish signals—such as hints at potential rate cuts or a slowdown in balance sheet reduction—it could bolster market risk appetite, benefiting technology and growth stocks. Conversely, a hawkish tone emphasizing persistent inflation and the necessity of maintaining high interest rates may dampen market sentiment, particularly impacting interest rate–sensitive sectors like real estate and utilities.
3. February 19 – Federal Reserve Releases January FOMC Meeting Minutes
The minutes are expected to shed light on internal discussions surrounding inflation, economic growth, and interest rate policy. Should they reveal an openness to rate cuts or an enhanced confidence in achieving a soft landing, U.S. equities might rally. Conversely, if the minutes emphasize maintaining a restrictive policy until inflation reaches target levels, it could spark concerns about tightening liquidity and lead to a short-term market correction.
4. February 20 – Initial Jobless Claims (Previous: 212K as of February 15)
If the initial jobless claims come in lower than expected (e.g., below 200K), it would indicate a robust labor market, potentially intensifying worries of an overheating economy and diminishing expectations for rate cuts, thereby exerting short-term pressure on equities. Conversely, if the data exceeds expectations (e.g., above 230K), it would suggest a cooling labor market, possibly reinforcing expectations for rate cuts and benefiting growth stocks and bonds.
– U.S. Leading Economic Index for January (Previous: -0.10%)
This index provides insights into the economic outlook over the next three to six months. A positive reading could signal an improving economic outlook and bolster confidence in a soft landing, benefiting cyclical sectors like energy and financials. Conversely, further declines might heighten recession concerns, prompting a rotation into defensive sectors such as utilities and consumer staples.
6. February 21 – S&P Global U.S. Services PMI Preliminary for February (Previous: 52.9)
Since the services sector accounts for approximately 80% of U.S. GDP, a reading above 52.9 would indicate accelerated expansion in this sector, potentially lifting shares in consumer services companies—including retail, tourism, and technology services. Conversely, a reading below 50 (the contraction threshold) could negatively impact these sectors.
Key Companies to Watch: Amazon (AMZN), Starbucks (SBUX), Delta Air Lines (DAL).
– S&P Global U.S. Manufacturing PMI Preliminary for February (Previous: 50.7)
A previous reading of 50.7 suggests marginal expansion in the manufacturing sector. Should the data rebound significantly (e.g., above 52), it could support industrial stocks such as Caterpillar (CAT) and General Electric (GE). However, a reading below 50 might raise concerns about a manufacturing downturn, potentially affecting raw materials and heavy machinery sectors adversely.
Crypto ETF Technical Analysis:
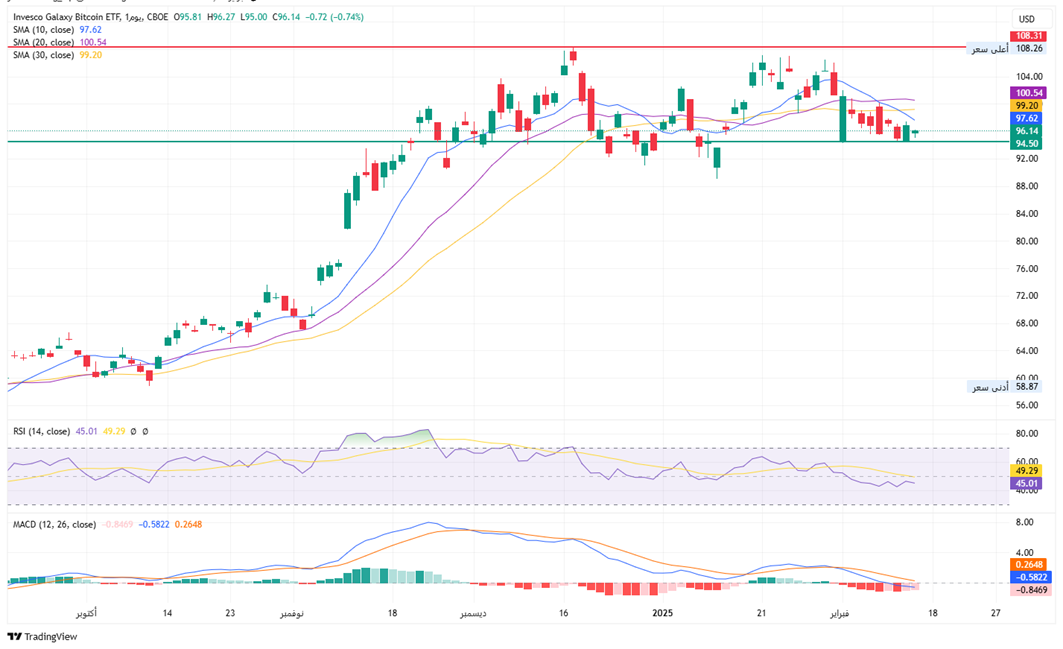
Following a noticeable upward rally, BTCO is now in a consolidation phase at high levels. The price has been oscillating between 95 and 105, and the emergence of several small bearish candles indicates that bears hold a slight advantage in the short term. Investor sentiment has turned cautious, with profit-taking pressure beginning to materialize.
The chart shows that the 95 level has repeatedly served as support; if the market weakens, this area could attract buying interest. Conversely, a break below 95 should raise concerns about a potential decline toward the 90–92 zone. Meanwhile, the 100–101 range is acting as a recent resistance area. Only with a volume-supported breakout and a sustained hold above this level will the market be in a position to challenge higher levels, potentially targeting the 105 and even 110+ zones.
The RSI is currently oscillating between 40 and 45 and has broken below the 50, indicating that short-term market sentiment is relatively neutral to slightly bearish. The MACD’s main line and signal line are close to the zero axis, with the histogram hovering around or even slightly below zero, reflecting weak market momentum. Despite short-term adjustment pressures, the overall uptrend in the medium- to long-term moving averages remains intact. As long as the price does not break below key previous support levels (such as the 95 area or lower), the medium-term bullish structure continues to support a reasonably optimistic outlook.
Disclaimer:
Sahm is subject to the supervision and control of the CMA, pursuant to its license no. 22251-25 issued by CMA.
The Information presented above is for information purposes only, which shall not be intended as and does not constitute an offer to sell or solicitation for an offer to buy any securities or financial instrument or any advice or recommendation with respect to such securities or other financial instruments or investments. When making a decision about your investments, you should seek the advice of a professional financial adviser and carefully consider whether such investments are suitable for you in light of your own experience, financial position and investment objectives. The firm and its analysts do not have any material interests or conflicts of interest in any companies mentioned in this report.
Performance data provided is accurate and sourced from reliable platforms, including Argaam, TradingView, MarketWatch.
IN NO EVENT SHALL SAHM CAPITAL FINANCIAL COMPANY BE LIABLE FOR ANY DAMAGES, LOSSES OR LIABILITIES INCLUDING WITHOUT LIMITATION, DIRECT OR INDIRECT, SPECIAL, INCIDENTAL, CONSEQUENTIAL DAMAGES, LOSSES OR LIABILITIES, IN CONNECTION WITH YOUR RELIANCE ON OR USE OR INABILITY TO USE THE INFORMATION PRESENTED ABOVE, EVEN IF YOU ADVISE US OF THE POSSIBILITY OF SUCH DAMAGES, LOSSES OR EXPENSES.
