Saudi Market
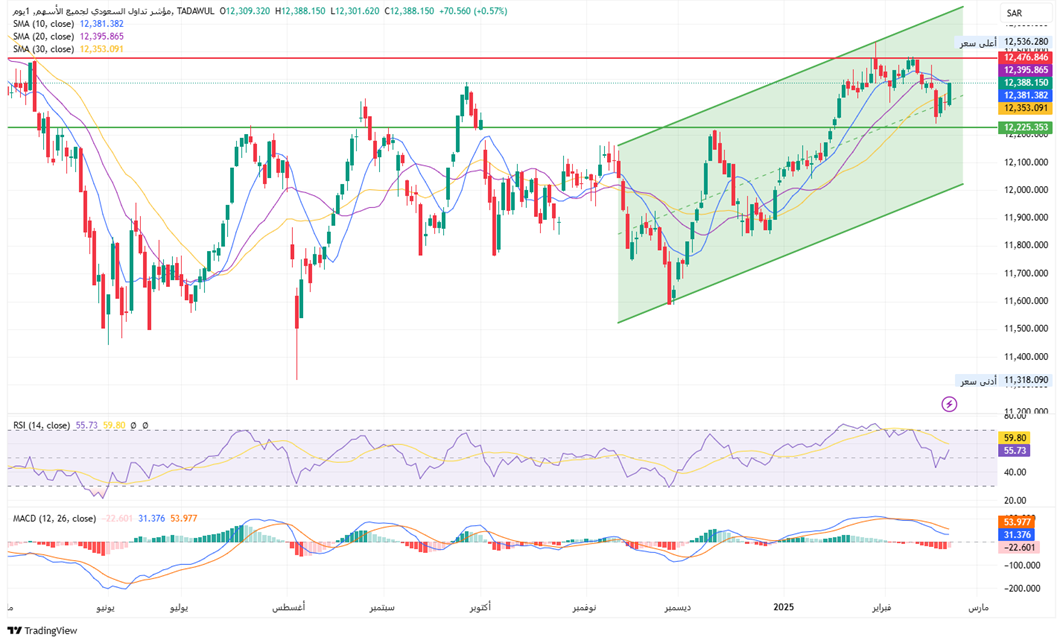
TASI Technical Analysis:
The TASI index is still within an upward channel. Recently, it reached a high point near the previous important resistance level of 12,476 points, where it encountered resistance and then pulled back. If the index can find support at the support level (around 12,225 points) and move up again, it is expected to challenge the strong resistance of 12,476 points once more. On the contrary, if it fails to hold the support level, further correction risks need to be guarded against.
RSI is near 50, indicating that market sentiment is relatively neutral, neither extremely overbought nor obviously oversold. MACD is currently above the zero axis, but the fast and slow lines are close, and the momentum of the histogram is weakening, indicating that the bullish force has weakened, and the short-term may continue to fluctuate.
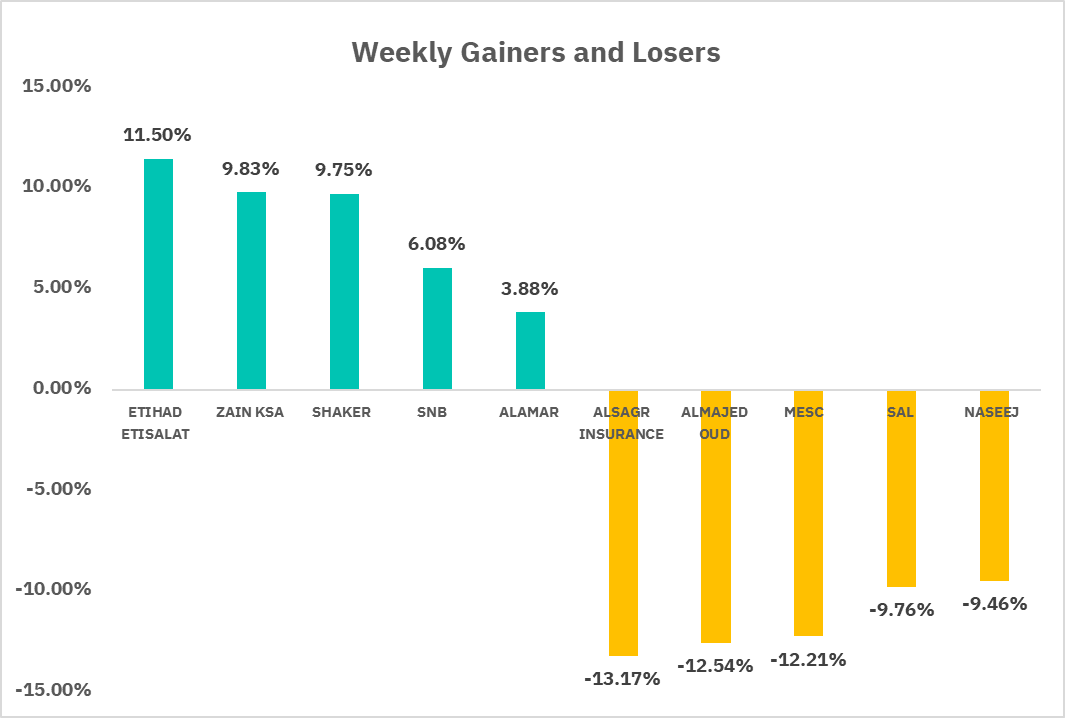
TASI Index Weekly Market Summary (February 16 to February 20)
Over the past week, the TASI exhibited a slight upward trend, with the index increasing by 0.13%. The average daily turnover stood at SAR 5,428 million, with a total turnover of SAR 27,143 million over the five trading days. In terms of market performance, there were 58 gainers and 201 losers. Notable gainers included ETIHAD ETISALAT, which saw a 11.50% increase, and ZAIN KSA, which rose by 9.83%. On the flip side, significant losers included ALSAGR INSURANCE, which declined by 13.17%, and ALMAJED OUD, which dropped by 12.54%. Overall, the market experienced a moderate increase, with certain companies showing notable gains while others faced substantial losses.
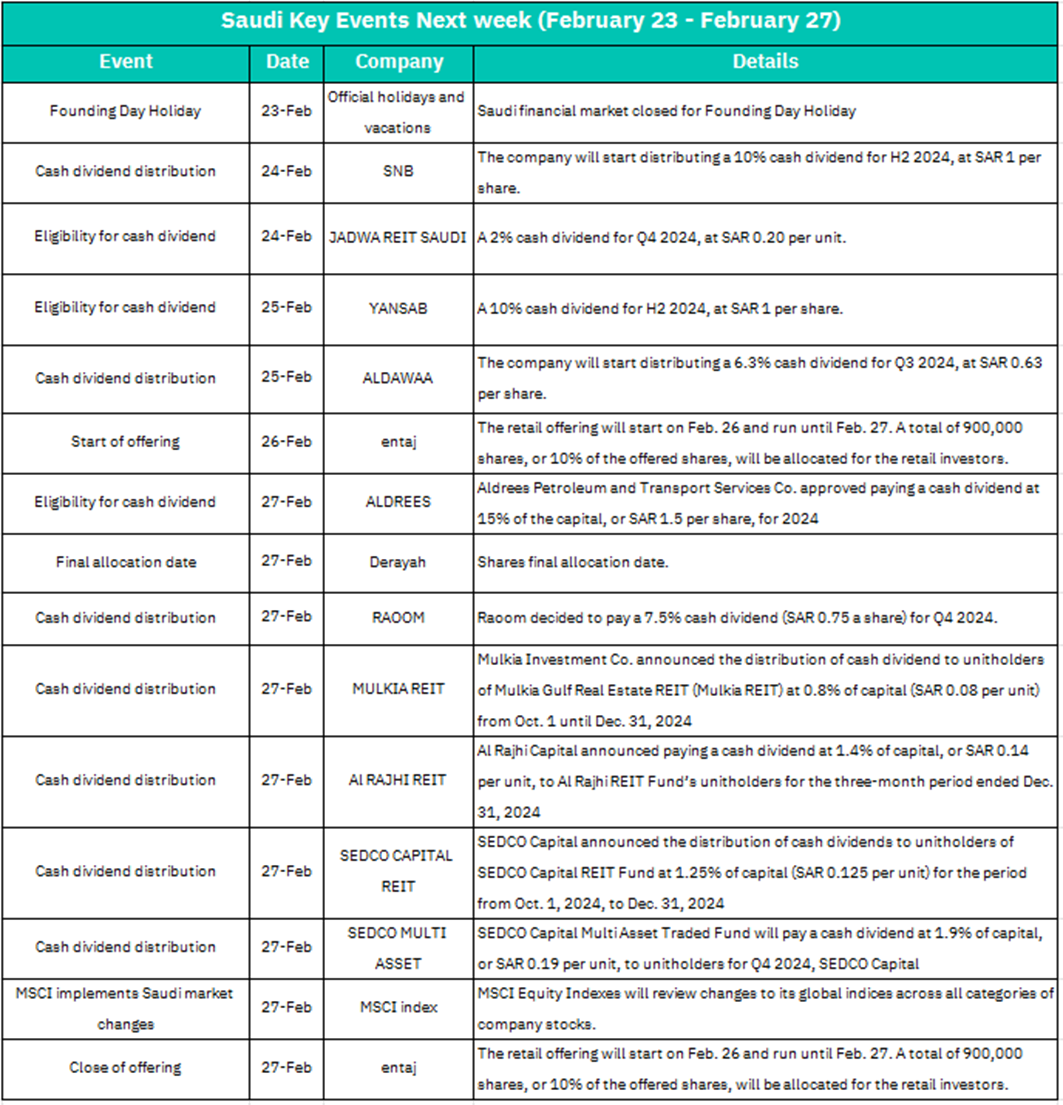
1. February 23: Saudi financial market closed for Founding Day Holiday. The closure of the financial market means that there will be no trading activities on this day.
2. February 24: SNB will start distributing a 10% cash dividend for H2 2024, at SAR 1 per share. JADWA REIT SAUDI announced 2% cash dividend for Q4 2024, at SAR 0.20 per unit. The distribution of cash dividends is generally seen as a positive sign for a company's financial health.
3. February 25: YANSAB's decision to pay a 10% cash dividend is a strong indication of its financial performance. Company is able to pay such a high dividend could attract new investors who are interested in companies with strong profit. ALDAWAA will start distributing a 6.3% cash dividend for Q3 2024, at SAR 0.63 per share.
4. February 26: entaj retail offering will start on Feb. 26 and run until Feb. 27. A total of 900,000 shares, or 10% of the offered shares, retail investors might be attracted to the opportunity to invest in entaj at an early stage.
5. February 27: Aldrees Petroleum and Transport Services Co. approved paying a cash dividend at 15% of the capital, or SAR 1.5 per share, for 2024. ALDREES's high dividend payout ratio is a significant positive for its shareholders. It shows that the company has a strong financial position and is willing to share its profits generously.
The final allocation date is an important milestone for Derayah. It means that the company's shares will be officially distributed to the investors who have applied for them.
Raoom decided to pay a 7.5% cash dividend (SAR 0.75 a share) for Q4 2024.
Mulkiya Investment Co. announced the distribution of cash dividend to unitholders of Mulkiya Gulf Real Estate REIT (Mulkiya REIT) at 0.8% of capital (SAR 0.08 per unit) from Oct. 1 until Dec. 31, 2024.
Al Rajhi Capital announced paying a cash dividend at 1.4% of capital, or SAR 0.14 per unit, to Al Rajhi REIT Fund's unitholders for the three - month period ended Dec. 31, 2024.
SEDCO Capital announced the distribution of cash dividends to unitholders of SEDCO Capital REIT Fund at 1.25% of capital (SAR 0.125 per unit) for the period from Oct. 1, 2024, to Dec. 31, 2024.
SEDCO Capital Multi - Asset Traded Fund will pay a cash dividend at 1.9% of capital, or SAR 0.19 per unit, to unitholders for Q4 2024.
MSCI Equity Indexes will review changes to its global indices across all categories of company stocks.
The entaj retail offering will start on Feb. 26 and run until Feb. 27. A total of 900,000 shares, or 10% of the offered shares, will be allocated for the retail investors. The closing of the offering marks the end of the initial stage of entaj's public offering.
U.S. Market
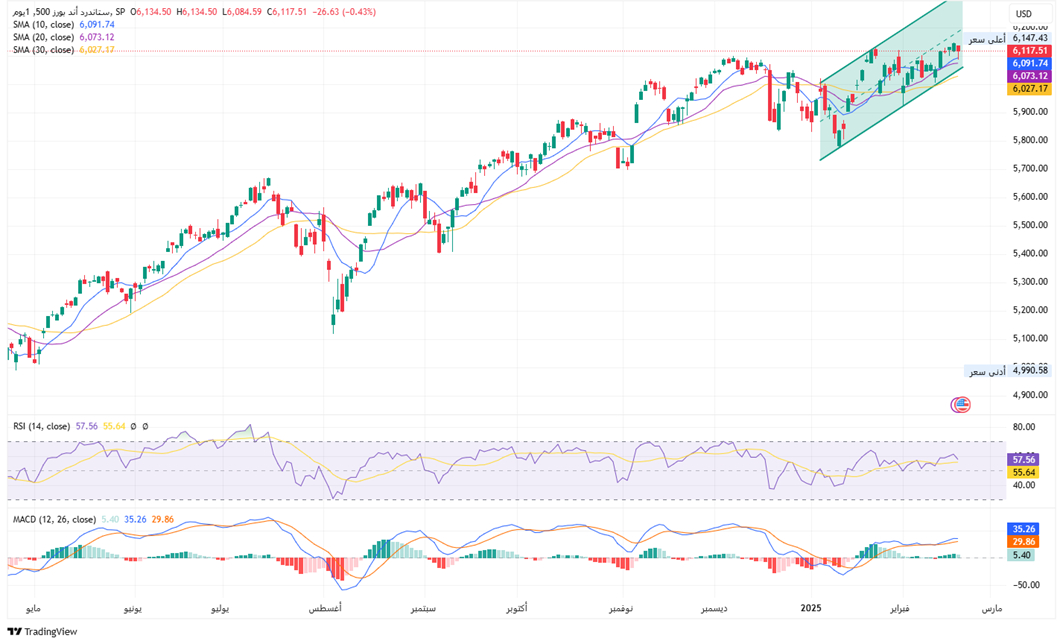
S&P500 Technical Analysis:
The S&P 500 is in a relatively obvious rising channel recently (green rising channel in the figure). Since November-December last year, the index has fluctuated upward as a whole and is still running within the channel. The price has been supported at the lower track of the channel or the short-term moving average many times, indicating that the buying intention is still strong. Only when the price effectively falls below the lower track of the channel and the key moving average support, we need to be alert to a deeper correction. Currently, the (10-day) and (20-day) moving averages are above the (30-day) moving average, showing a bullish arrangement, indicating that the medium- and long-term trend of the index remains upward. The price has also been running above the three moving averages, and the short-term moving average (20-day) has a relatively obvious support effect on the price.
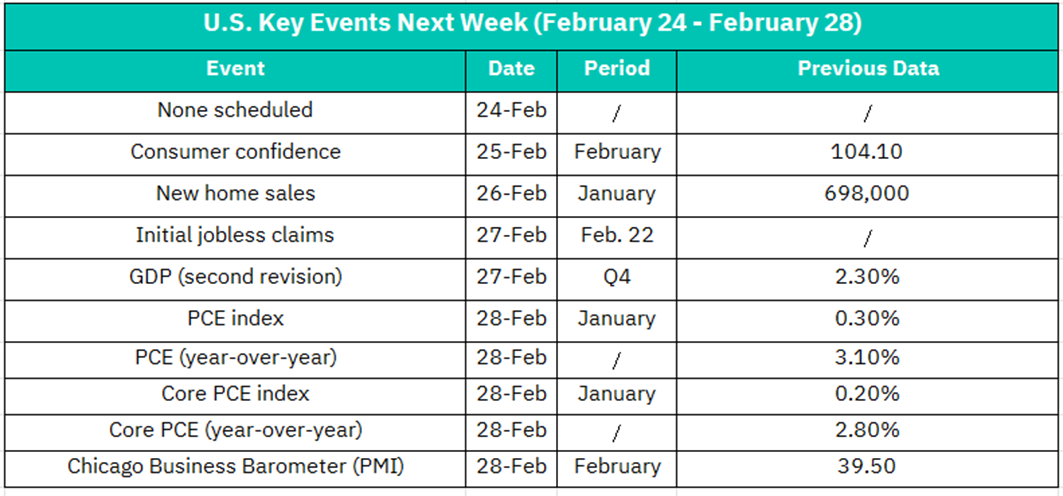
1. February 24: None scheduled
2. February 25: – Consumer confidence
Consumer confidence is an important indicator of the health of the economy. A higher consumer confidence reading suggests that consumers are more optimistic about the economy and are more likely to spend money. If the consumer confidence index for February shows an increase, it could have a positive impact on the stock market.
3. February 26 – New home sales
New home sales data provides insights into the housing market, which is a key sector of the economy. An increase in new home sales could signal a strong housing market, which is generally positive for the overall economy and the stock market.
4. February 27 – Initial Jobless Claims
Initial jobless claims data is a real - time indicator of the labor market conditions. A lower number of initial jobless claims suggests a healthier labor market, which is positive for the stock market. It indicates that companies are hiring and the economy is growing. If the initial jobless claims for the week of Feb. 22 show a decrease, it could boost investor confidence and have a positive impact on the market.
– GDP (second revision)
The second revision of GDP data for the fourth quarter is closely watched by investors and economists. It provides a more accurate picture of the country's economic performance. If the revised GDP growth rate is higher than the previous estimate, it could be a positive sign for the stock market, indicating a stronger economy.
5. February 28 – PCE index
The PCE (Personal Consumption Expenditures) index is a key measure of inflation. A higher PCE index indicates rising inflation, which could have a negative impact on the stock market. Investors might worry about the potential for higher interest rates, which could increase borrowing costs for companies and reduce their profitability.
– PCE (year - over - year)
The year - over - year PCE data provides a longer - term view of inflation trends. A high year - over - year PCE rate could indicate persistent inflationary pressures, which might lead to a more hawkish monetary policy stance from the Federal Reserve.
– Core PCE index
The core PCE index, which excludes volatile food and energy prices, is a more stable measure of inflation. It is closely monitored by the Federal Reserve when making monetary policy decisions. If the core PCE index for January shows a significant increase, it might raise concerns about inflation and could have a negative impact on the stock market.
– Chicago Business Barometer (PMI)
The Chicago Business Barometer, also known as the Chicago PMI, is a leading indicator of the manufacturing sector in the Chicago region. A reading above 50 indicates expansion in the manufacturing sector, while a reading below 50 indicates contraction. If the February Chicago Business Barometer shows an increase and moves above 50, it could be a positive sign for the stock market, especially for industrial and manufacturing stocks. It would suggest that the manufacturing sector is improving, which is generally good for the overall economy. However, if the index remains below 50 or shows a further decline, it might raise concerns about the manufacturing sector and could have a negative impact on the market.
Disclaimer:
Sahm is subject to the supervision and control of the CMA, pursuant to its license no. 22251-25 issued by CMA.
The Information presented above is for information purposes only, which shall not be intended as and does not constitute an offer to sell or solicitation for an offer to buy any securities or financial instrument or any advice or recommendation with respect to such securities or other financial instruments or investments. When making a decision about your investments, you should seek the advice of a professional financial adviser and carefully consider whether such investments are suitable for you in light of your own experience, financial position and investment objectives. The firm and its analysts do not have any material interests or conflicts of interest in any companies mentioned in this report.
Performance data provided is accurate and sourced from reliable platforms, including Argaam, TradingView, MarketWatch.
IN NO EVENT SHALL SAHM CAPITAL FINANCIAL COMPANY BE LIABLE FOR ANY DAMAGES, LOSSES OR LIABILITIES INCLUDING WITHOUT LIMITATION, DIRECT OR INDIRECT, SPECIAL, INCIDENTAL, CONSEQUENTIAL DAMAGES, LOSSES OR LIABILITIES, IN CONNECTION WITH YOUR RELIANCE ON OR USE OR INABILITY TO USE THE INFORMATION PRESENTED ABOVE, EVEN IF YOU ADVISE US OF THE POSSIBILITY OF SUCH DAMAGES, LOSSES OR EXPENSES.


