
What is a candlestick?
A candlestick is a way of displaying information about an asset’s price movement, and it is one of the most popular components of technical analysis, enabling traders to interpret price information quickly from just a few price bars. It has three basic features:
- The body, which represents the open-to-close range.
- The wick, or shadow, that indicates the intra-day high and low.
- The color, which reveals the direction of market movement – a green body indicates a price increase, while a red body shows a price decrease.
Candlesticks are created by up and down movements in the price. While these price movements sometimes appear random, at other times they form patterns that traders use for analysis or trading purposes.
Six bullish candlestick patterns
1. Bullish engulfing pattern
The bullish engulfing pattern is formed of two candlesticks. The first candle is a short red body that is completely engulfed by a larger green candle.
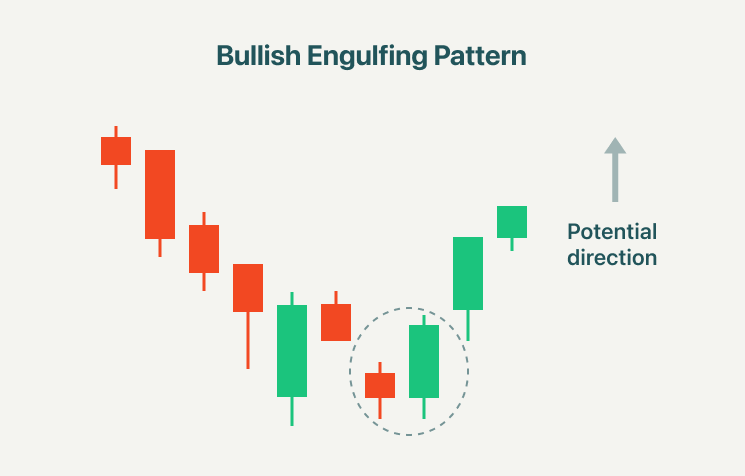
This pattern appears in a downtrend and is a combination of one red candle followed by a larger green candle. On the second day of the pattern, the price opens lower than the previous low, yet buying pressure pushes the price up to a higher level than the previous high, culminating in an obvious win for the buyers. An engulfing pattern on the bullish side of the market takes place when buyers outpace sellers. With bulls having established some control, the asset price could head higher.
2. Morning star
The morning star candlestick pattern is considered a sign of hope in a bleak market downtrend. It is a three-stick pattern: one short-bodied candle between a long red and a long green. Traditionally, the “star” will have no overlap with the longer bodies, as the market gaps both on open and close.
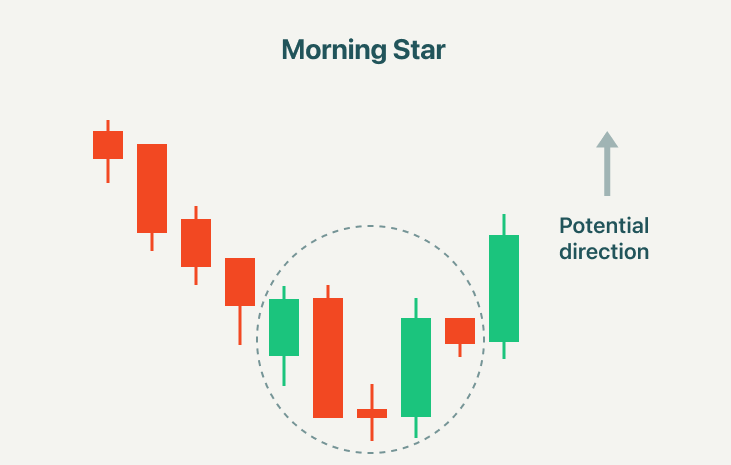
A morning star pattern is a bullish reversal pattern that appears at the bottom of a downtrend. It indicates that sellers have lost their momentum, and buyers have taken control over the price in an uptrend.
3. Hammer
The hammer candlestick pattern is formed of a short body with a long lower shadow, and is found at the bottom of a downward trend.
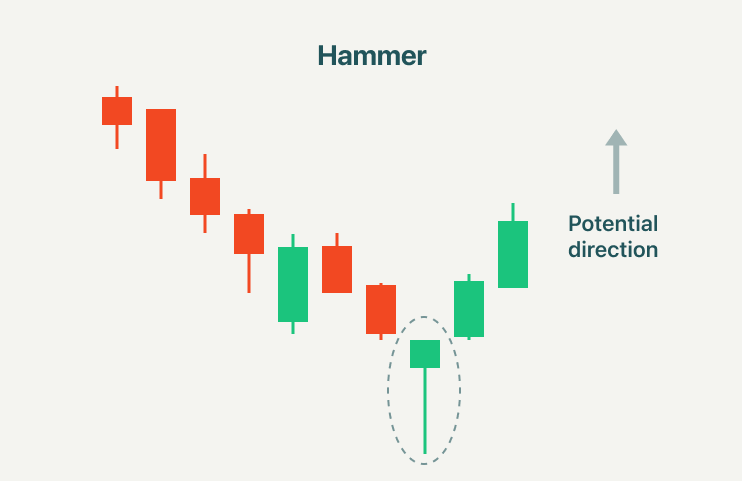
A hammer shows that although there were selling pressures during the day, ultimately a strong buying pressure drove the price back up. The color of the body can vary, but green hammers indicate a stronger bull market than red hammers.
4. Three white soldiers
The three white soldiers pattern occurs over three days. It consists of consecutive long green candles with small shadows, which open and close progressively higher than the previous day.
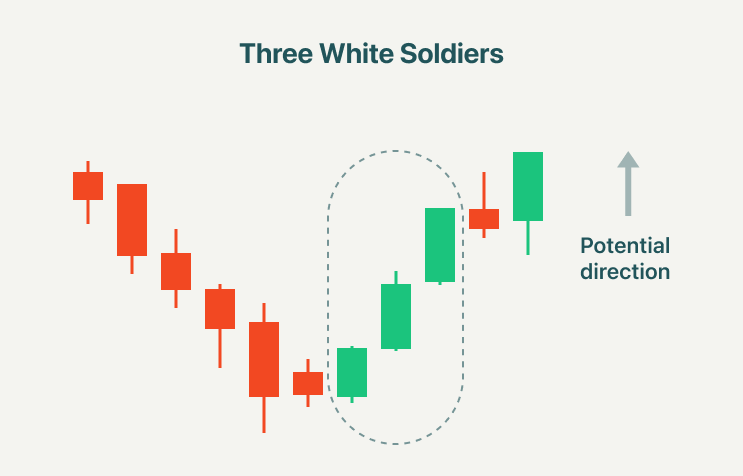
The three white soldiers candlestick pattern suggests a strong change in market sentiment in terms of the asset making up the price action on the chart. It is a very strong bullish signal that occurs after a downtrend, and shows a steady advance of buying pressure.
5. Piercing line
A piercing pattern is a two-day, candlestick price pattern that marks a potential short-term reversal from a downward trend to an upward trend. It is made up of a long red candle, followed by a long green candle.
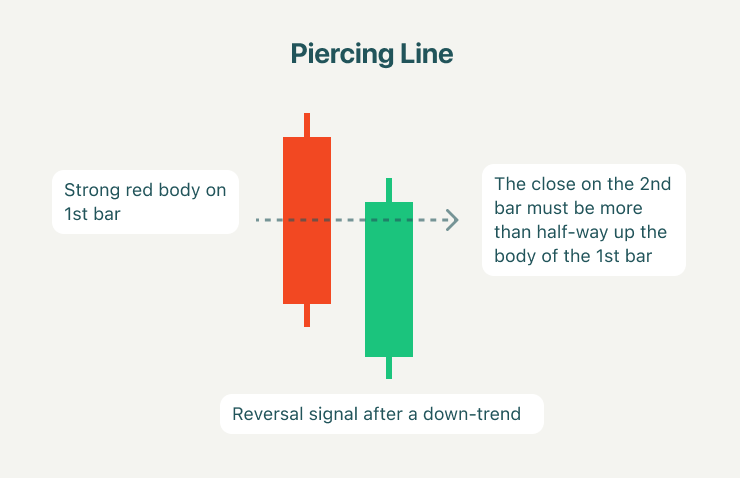
The piercing line pattern is seen as a bullish reversal candlestick pattern located at the bottom of a downtrend. It frequently prompts a reversal in trend as bulls enter the market and push prices higher.
6. Bullish harami
A bullish harami is a candlestick chart indicator suggesting that a bearish trend may be coming to end. Some investors may look at a bullish harami as a good sign that they should enter a long position on an asset.
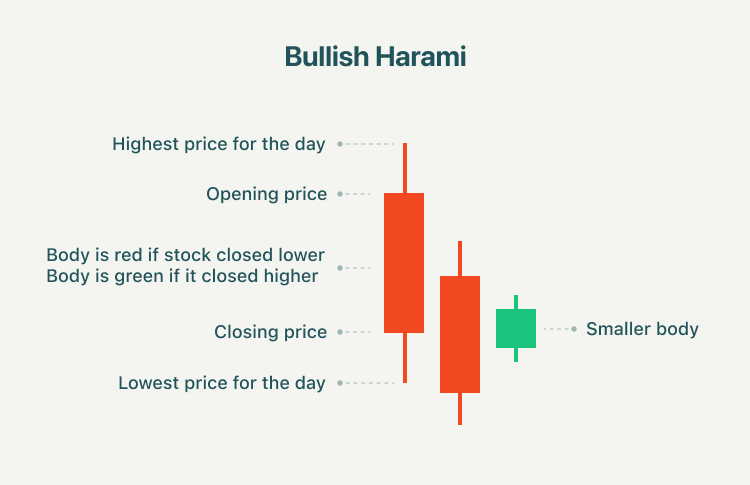
As the image above shows, the first two red candles indicate a two-day downward trend in the asset, and the green candle represents a slightly upward trend on the third day, which is completely contained by the body of the previous candle. Investors seeing this bullish harami may be encouraged by this diagram, as it can signal a reversal in the market.
