1. Bearish engulfing pattern
A bearish engulfing pattern occurs at the end of an uptrend. The pattern consists of a green candlestick followed by a large red candlestick that eclipses or "engulfs" the smaller up candle.
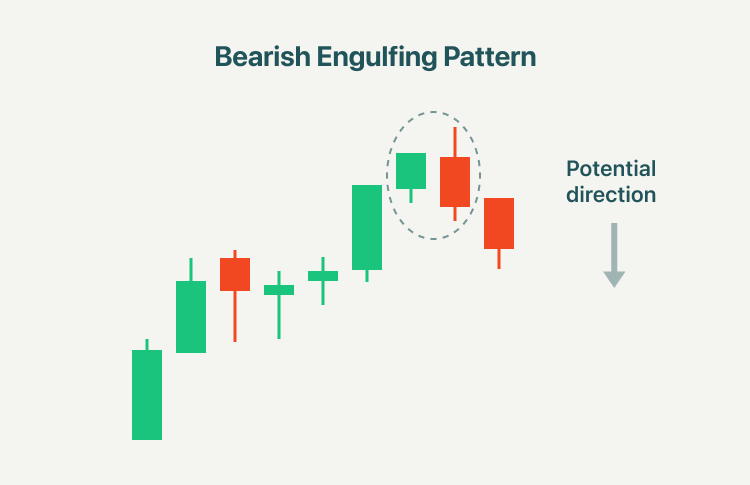
The pattern shows sellers have overtaken the buyers and are pushing the price more aggressively down than the buyers were able to push it up.
2. Evening star
The evening star pattern is considered a very strong indicator of future price declines. It consists of three candles: a large green candlestick, a small-bodied candle, and a red candle.
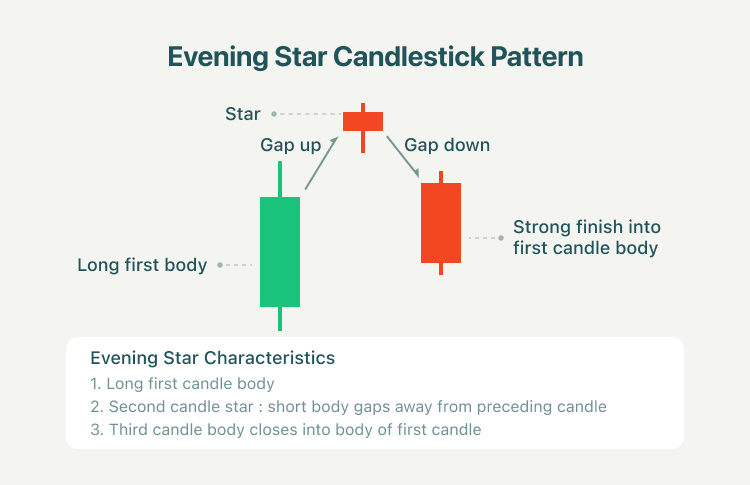
● The first day consists of a large green candle signifying a continued rise in prices.
● The second day consists of a smaller candle that shows a more modest increase in price.
● The third day shows a large red candle that opens at a price below the previous day and then closes near the middle of the first day.
The evening star is associated with the top of a price uptrend, signifying that the uptrend is nearing its end. The opposite of the evening star is the morning star pattern, which is viewed as a bullish indicator.
3. Bearish harami
A bearish harami is a two-candlestick pattern that suggests prices may soon reverse to the downside. The pattern consists of a long green candle followed by a small red candle. The opening and closing prices of the second candle must be contained within the body of the first candle.
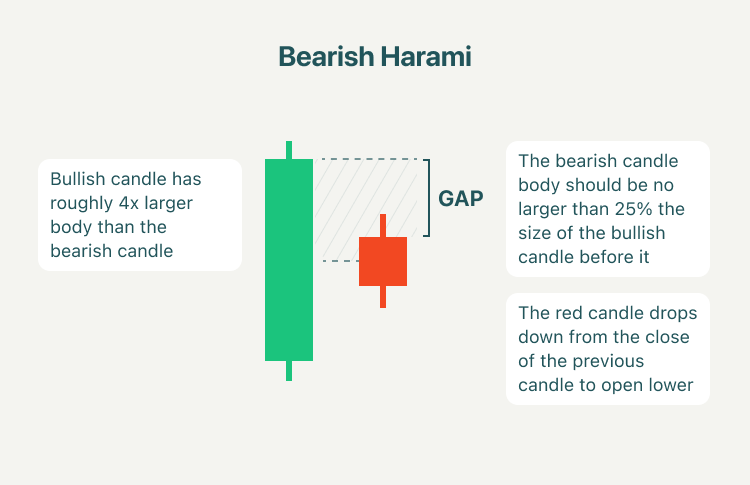
The size of the second candle determines the pattern's potency; the smaller it is, the higher the chance for a reversal to occur. The opposite pattern to a bearish harami is a bullish harami, which is preceded by a downtrend and suggests prices may reverse to the upside.
4. Bearish falling three
The falling three pattern is a bearish, five candle continuation pattern that signals an interruption, but not a reversal, of a current downtrend. The pattern is characterized by two long red candlesticks in the direction of the trend, one at the beginning and end, with three shorter green counter-trend candlesticks in the middle.
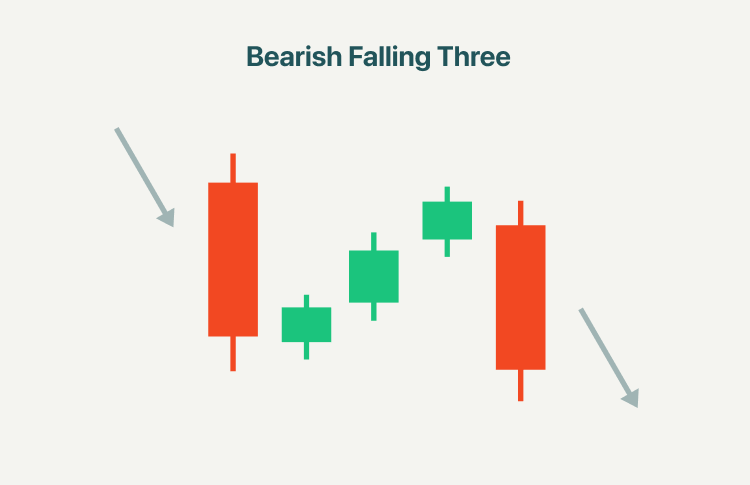
Bearish falling three occurs when a downtrend stalls as bears lack the momentum to keep pushing the security's price lower. This leads to a counter move that is often the result of profit-taking and, possibly, an attempt by eager bulls anticipating a reversal.
5. Shooting star
A shooting star is a bearish candlestick with a long upper shadow, little or no lower shadow, and a small real body near the low of the day.
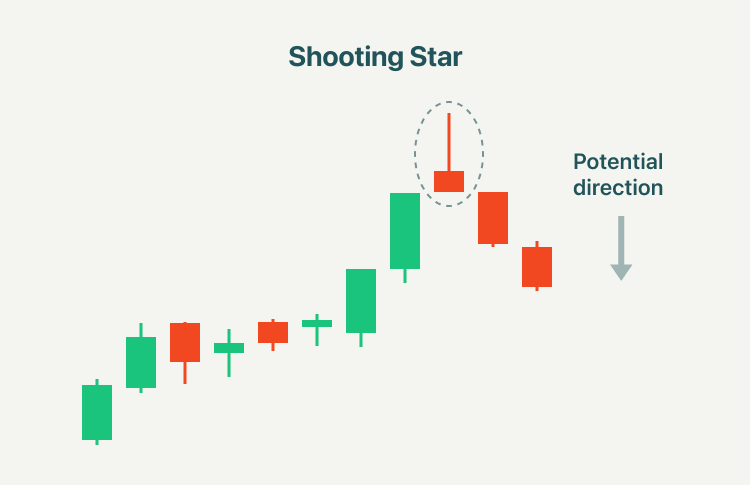
Usually, the market will gap slightly higher on opening and rally to an intra-day high before closing at a price just above the opening. The pattern signifies a peak or slowdown of price movement and is a sign of an impending market downturn. The lower the second candle goes, the more significant the trend is likely to be.
6. Dark cloud cover
The dark cloud cover candlestick pattern indicates a bearish reversal, a black cloud over the previous day’s optimism. It comprises two candlesticks: a red candlestick that opens above the previous green body and closes below its midpoint.
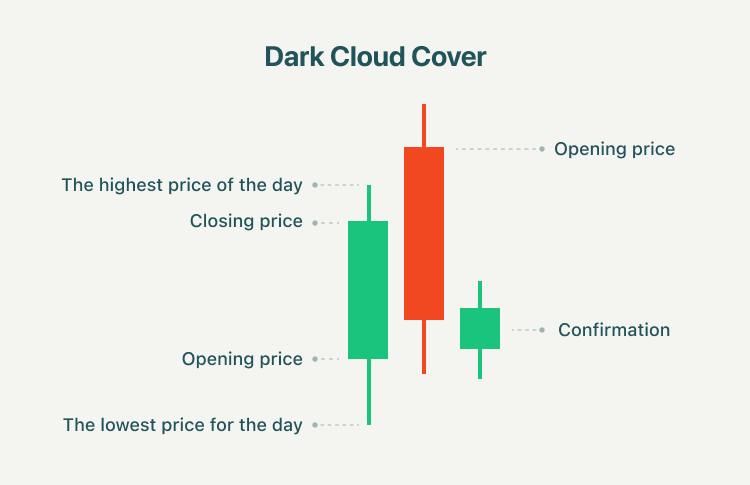
This pattern signals that the bears have taken over the session, pushing the price sharply lower. Traders may use the dark cloud cover to inform their selling decisions. Also, a trader can potentially exit a long position upon observing a dark cloud cover pattern.


