
Saudi Market
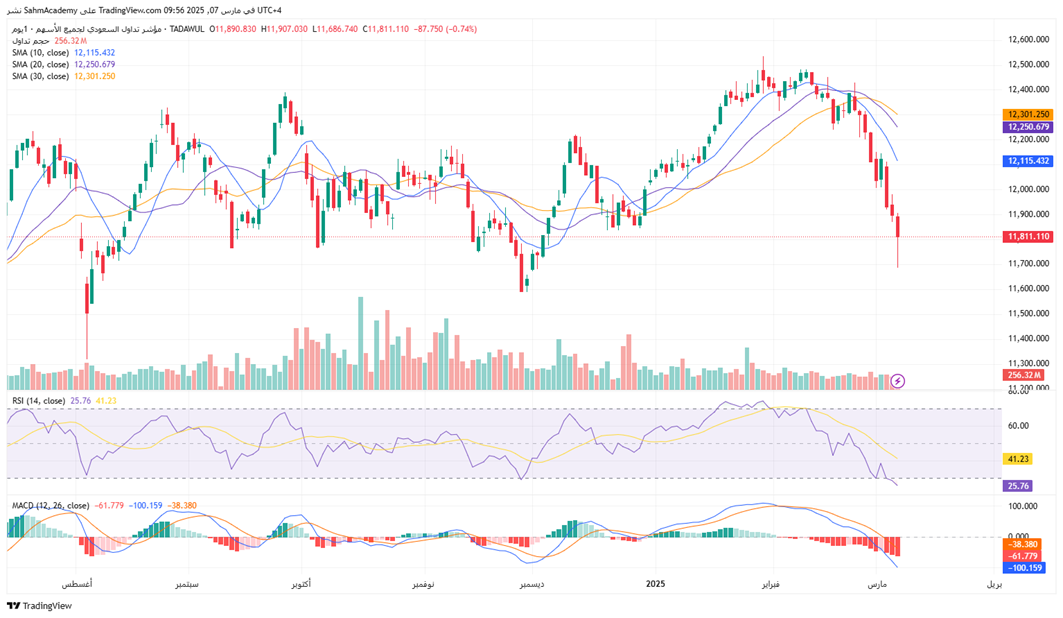
TASI Technical Analysis:
The index is in a strong bearish trend, with the current level around 11,800 acting as a support level and the next major support around 11,600. The price has broken below all key moving averages, which are in bearish alignment. The RSI of 25.76 indicates oversold conditions, suggesting a potential short - term bounce, but the strong negative MACD readings show the bearish momentum remains. The elevated trading volume of 256.32M indicates strong selling pressure. The immediate resistance is at the 10 - day SMA (12,115.432), and stronger resistance is at the 20 - day SMA (12,250.679). The overall assessment is bearish, and a break below 11,800 could accelerate the decline.
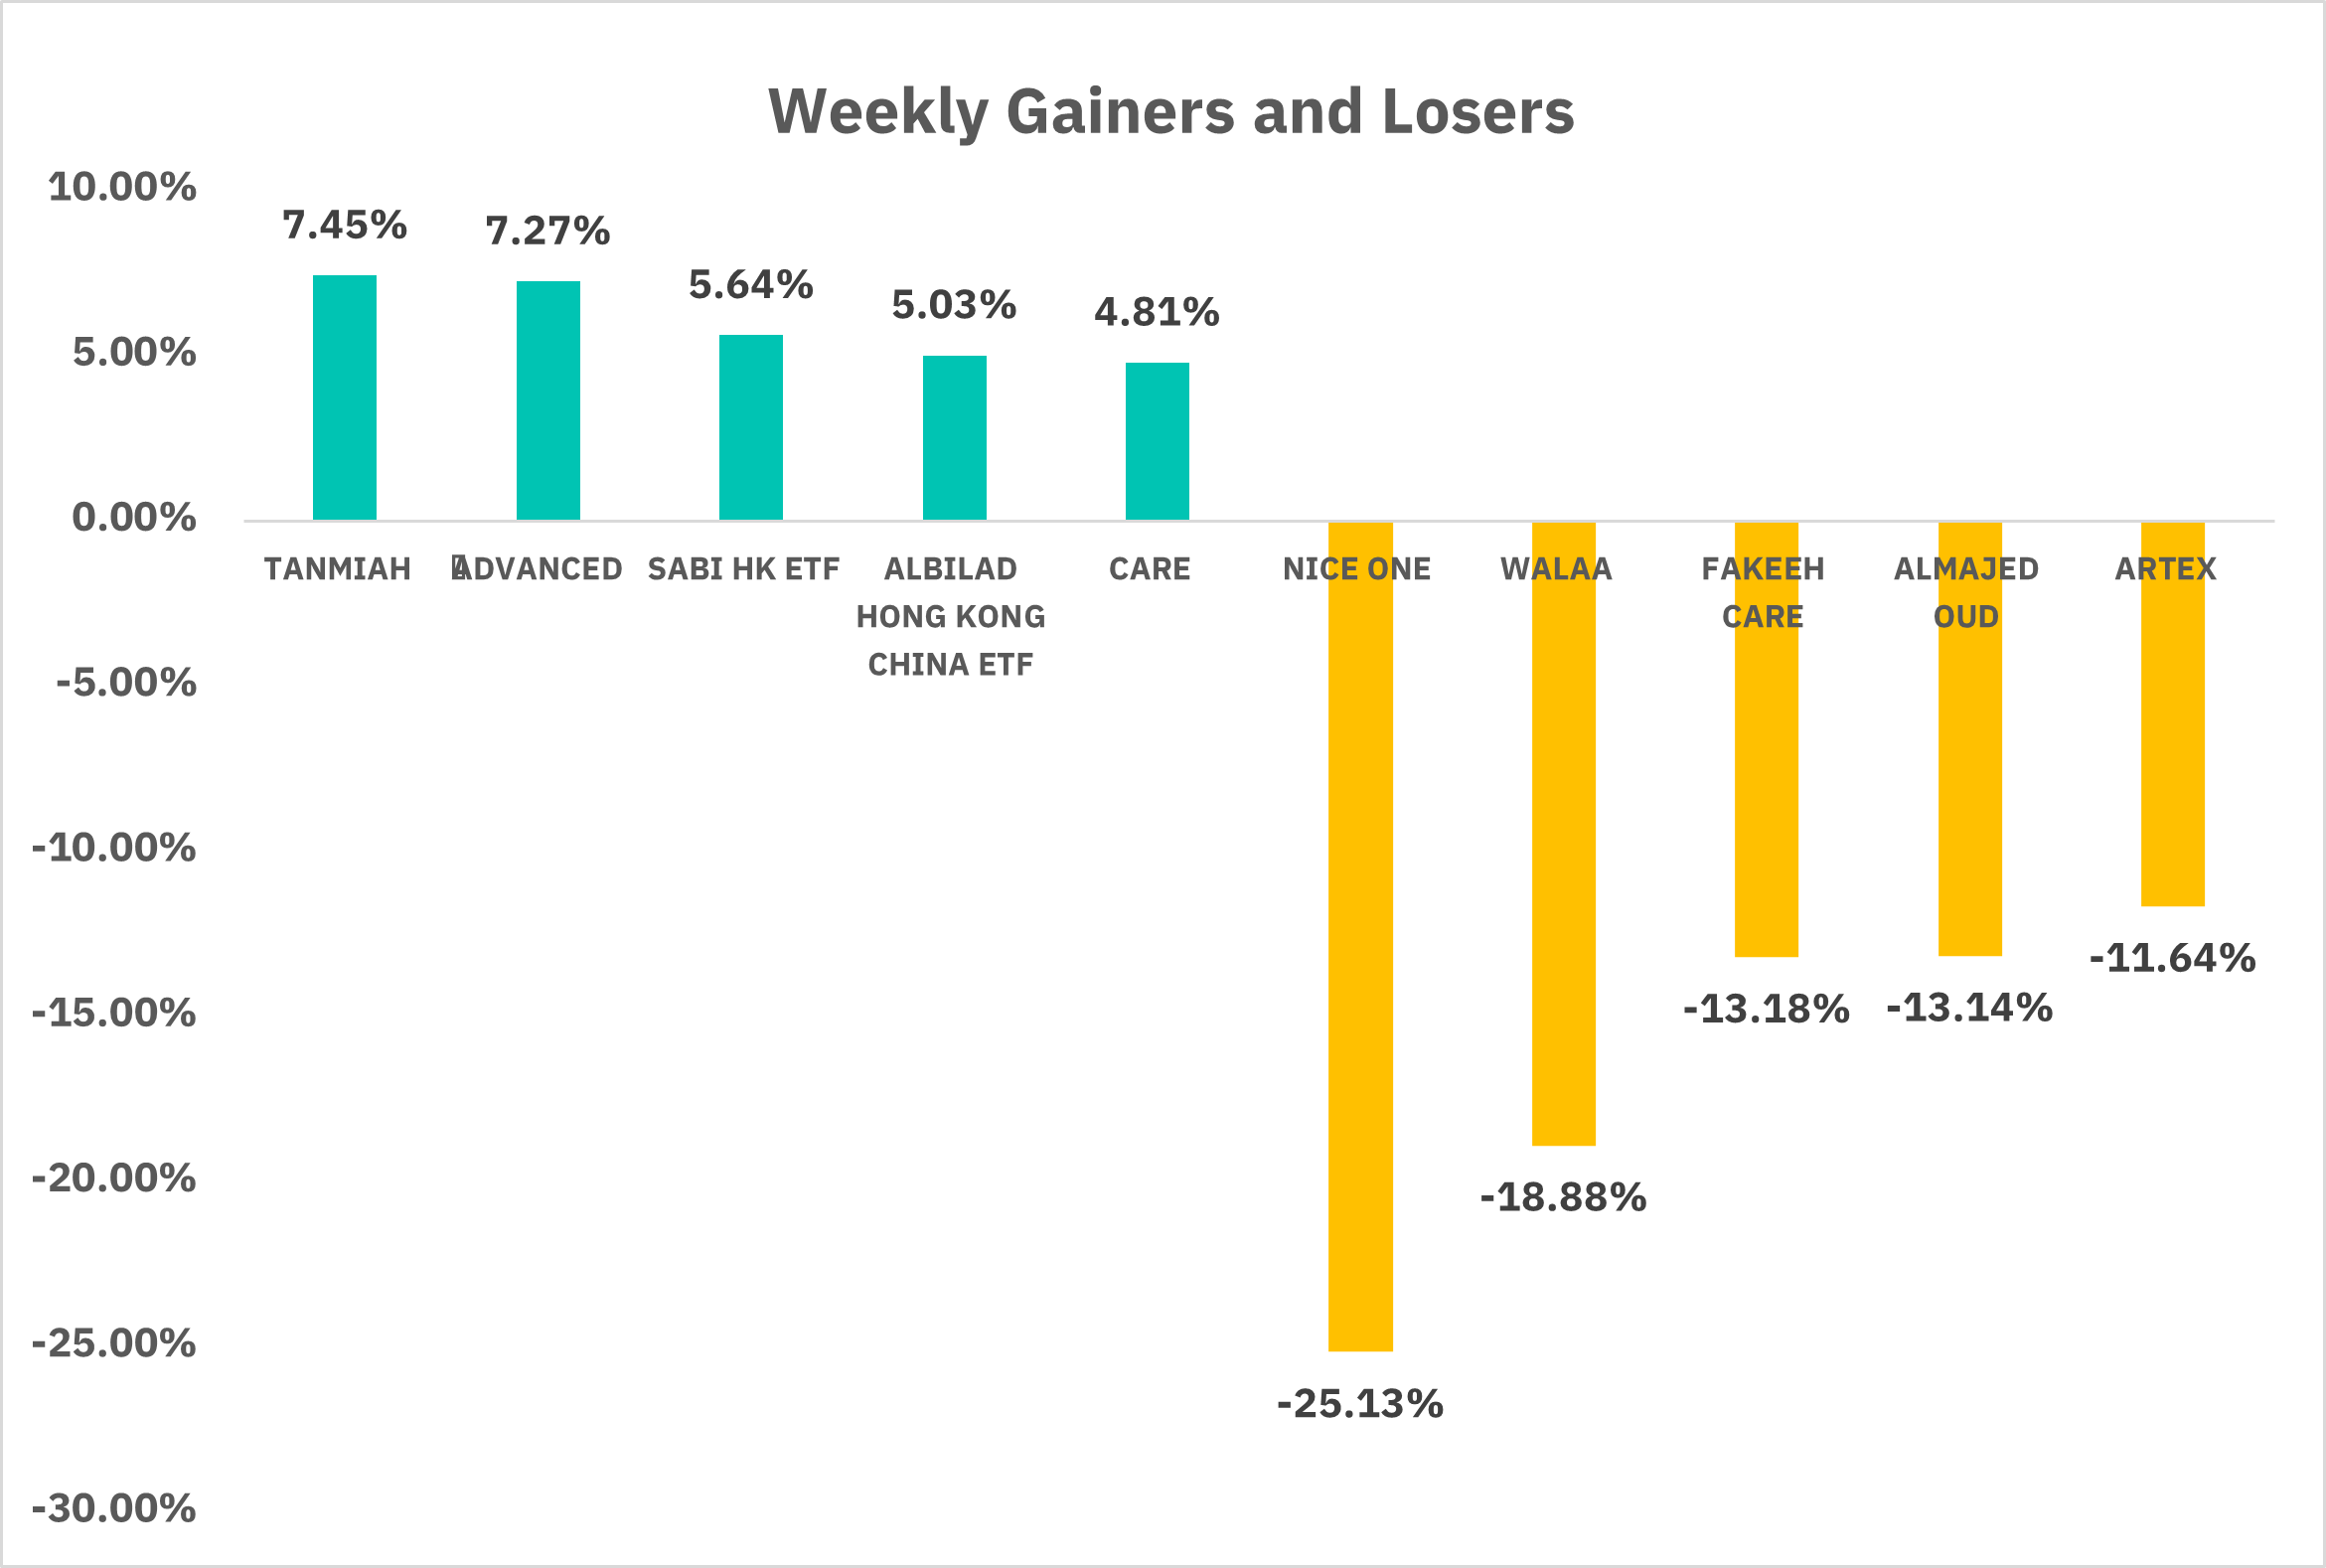
TASI Index Weekly Market Summary (March 2 to March 6)
Saudi Arabia's stock market had a remarkable week of fluctuations and showed a general downward trend. The TASI Index fell by 1.86%for the week, with high market turnover of 28.791 billion SAR. The market was divided: 45 stocks rose, led by TANMIAH and ADVANCED, up 7.45% and 7.27%, it is worth noting that due to the outstanding performance of the Hong Kong market last week, two Hong Kong ETFs were among the top five assets with the highest growth. While 218 stocks fell, with NICE ONE and WALAA, down 25.13% and 18.88%. Short - term volatility is likely to continue given the various factors influencing the market and investor caution.
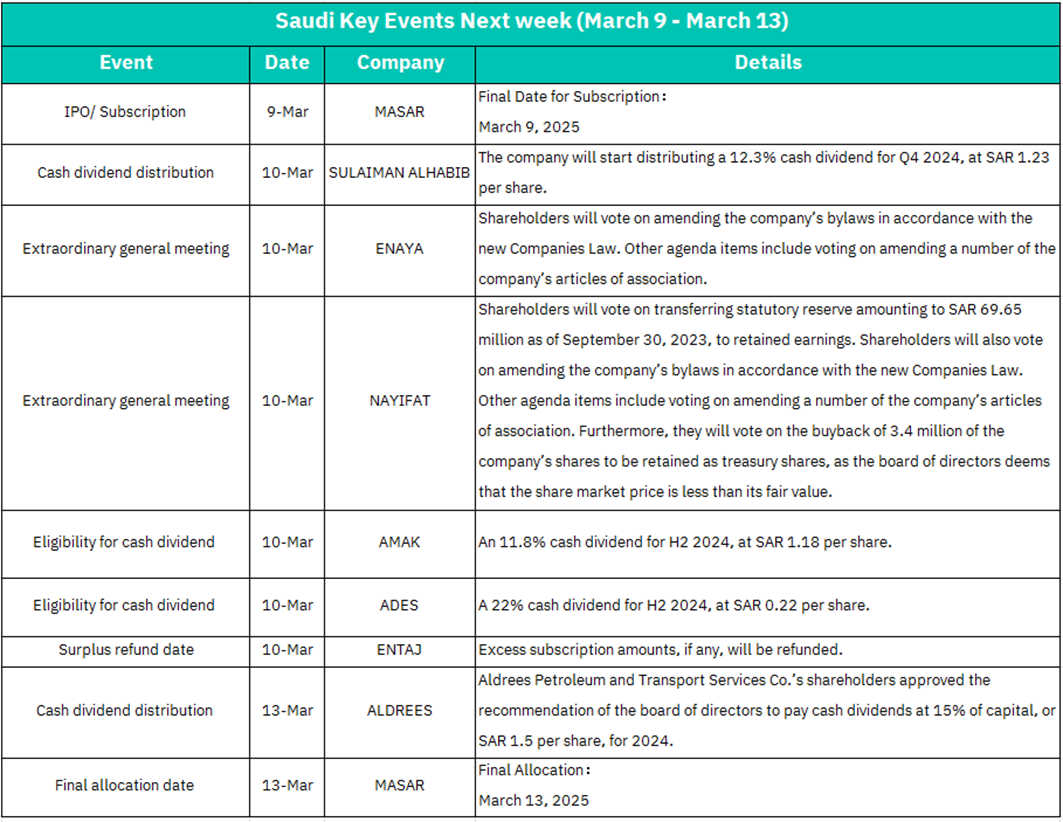
1. March 9: MASAR's IPO subscription deadline, investors must commit funds for subscription, which may cause short - term market liquidity tightening. Strong subscription demand may signal high IPO confidence, lifting sentiment in related sectors.
2. March 10:Cash dividend distribution by SULAIMAN ALHABIB, the company will start distributing a 12.3% cash dividend for Q4 2024, at SAR 1.23 per share. High - dividend companies may attract short - term capital inflows, potentially supporting stock prices before ex - date. After dividend payout, beware of "ex - dividend effect" as some investors may take profit.
Extraordinary General Meeting of ENAYA, Shareholders will vote on amending the company’s bylaws in accordance with the new Companies Law. Other agenda items include voting on amending a number of the company’s articles of association. Revised articles of association may enhance governance transparency, boosting long - term investor confidence.
Extraordinary General Meeting of NAYIFAT, Shareholders will vote on transferring statutory reserve amounting to SAR 69.65 million as of September 30, 2023, to retained earnings. Shareholders will also vote on amending the company’s bylaws in accordance with the new Companies Law. Furthermore, they will vote on the buyback of 3.4 million of the company’s shares to be retained as treasury shares, as the board of directors deems that the share market price is less than its fair value. Share repurchase program is usually positive and may lift short - term stock price.
Eligibility for cash dividend of AMAK, an 11.8% cash dividend for H2 2024, at SAR 1.18 per share.
Eligibility for cash dividend of ADES, a 22% cash dividend for H2 2024, at SAR 0.22 per share.
Surplus refund date of ENTAJ, excess subscription amounts, if any, will be refunded. has a limited direct impact on the stock price, but it may reflect the strength of market demand for its IPO and indirectly affect investor sentiment.
3. March 13: Cash dividend distribution by ALDREES, Aldrees Petroleum and Transport Services Co.’s shareholders approved the recommendation of the board of directors to pay cash dividends at 15% of capital, or SAR 1.5 per share, for 2024.
Final allocation date of MASAR, the final allocation of shares will determine the ownership structure of the company. If the allocation is favorable, it may boost investor confidence and potentially drive up the stock price in the short term.
U.S. Market
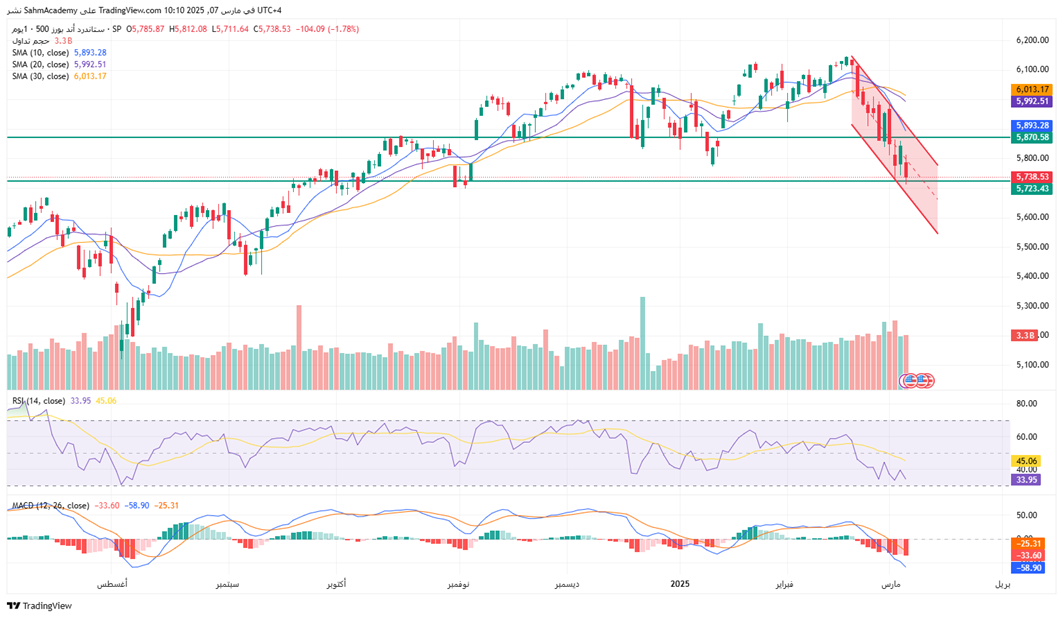
S&P500 Technical Analysis:
The security is experiencing a significant downtrend, with the current price approaching the 5,723-point support level after dropping below all major SMAs, which are aligned bearishly at 5,975.28, 5,992.51, and 6,013.17 for the 10, 20, and 50 SMAs, respectively. The RSI of 33.95 indicates potential oversold conditions, but the negative MACD of -33.60 and a histogram value of -25.31 show continued bearish momentum. Key resistance levels are around 5,870, 5,975, and 6,000. While a short - term bounce is possible near current levels due to oversold conditions, the primary trend remains downward.
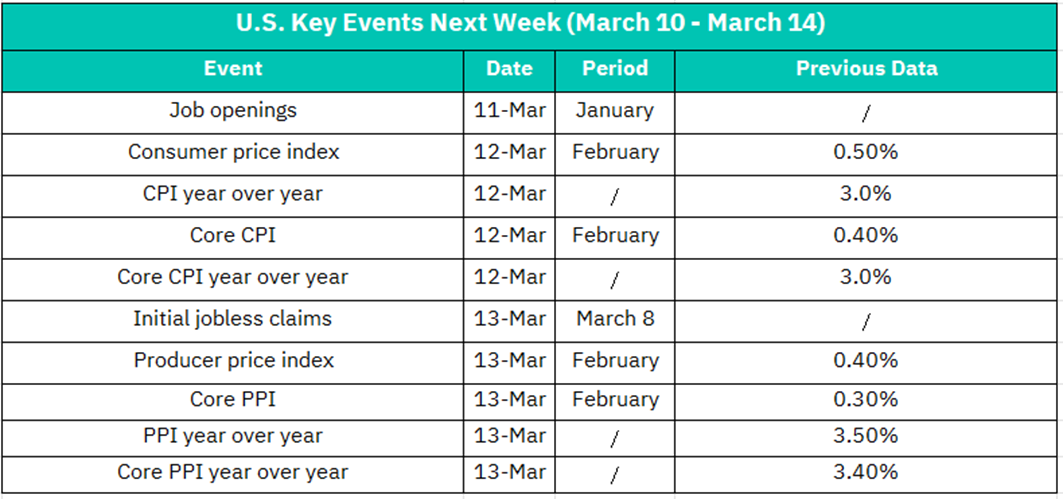
1. March 11 – Job openings
The JOLTs job openings data reflects the labor demand of enterprises. A notable increase in job openings usually indicates a tight labor market and strong corporate hiring demand. This may heighten market concerns over inflation and Fed rate hikes, thereby pressuring the stock market, especially growth stocks. Conversely, a decline in job openings signals a slowing labor market, which may ease inflationary pressures. The market might then expect a slower pace of Fed rate increases, which would be relatively positive for the stock market.
2. March 12 – Consumer Price Index (CPI)
Previous Value (Month-on-Month): 0.50%
Previous Value (Year-on-Year): 3.0%
-Core CPI
Previous Value (Month-on-Month): 0.40%
Previous Value (Year-on-Year): 3.0%
CPI month-on-month and year-on-year are among the most direct and closely watched indicators of inflation.
If the year-on-year increase in CPI exceeds market expectations, it often means that inflationary pressures are continuing or intensifying. Investors may worry that the Federal Reserve will continue or accelerate its interest rate hikes, putting downward pressure on the stock market, especially in high - valuation sectors.
If the year-on-year CPI comes in below expectations, it suggests that inflationary pressures may be easing. This could lead the Federal Reserve to slow down interest rate increases or send dovish signals, which would be positive for the stock market.
Core CPI is a better indicator of demand - driven inflation.
If core CPI growth remains high, it indicates that underlying inflationary pressures are still significant, and the market may expect continued tight monetary policy.
A significant drop in core CPI is usually seen as a signal that inflation has peaked or is easing, which is positive for the stock market.
3. March 13 – Initial Jobless Claims (Week ending March 8)
The number of initial jobless claims is one of the timeliest indicators of labor market changes.
If initial jobless claims remain low (or continue to decline), it indicates a still - robust job market. This may reinforce inflation and interest - rate hike expectations, putting some pressure on the stock market, especially in high - valuation sectors, but also reflects a solid economic fundamental.
A significant rise in initial jobless claims signals a slowing job market. This might make the Fed more cautious about tightening policies, which could be short - term positive for the stock market, but indicates a slightly weak economic fundamental.
– Producer Price Index (PPI)
Prior Value (Month-on-Month): 0.40%
Prior Value (Year-on-Year): 3.50%
–Core PPI (Year-on-Year)
Prior Value: 3.40%, PPI is a key indicator of cost changes at the corporate level, and high PPI may be transmitted to CPI, leading to higher overall inflation.
If PPI growth exceeds expectations, it may reinforce inflation expectations and the prospect of tighter monetary policy, which is negative for the stock market, especially for sectors sensitive to costs.
If PPI growth slows, it means a reduction in corporate cost pressures and a potential easing of market inflation concerns, which is positive for the stock market.
Core PPI provides a more accurate reflection of long - term supply chain and demand - driven price changes.
Similarly, a significant decline in the year - on - year growth of core PPI may signal a decrease in underlying inflationary pressures, which is relatively positive for the stock market.
Crypto ETF Technical Analysis:
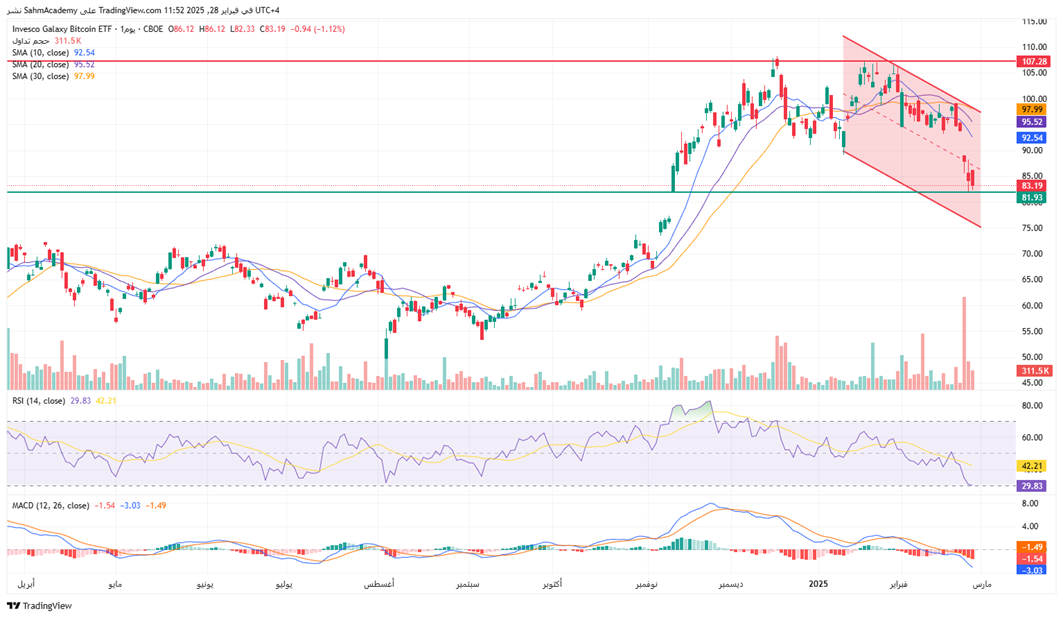
The Invesco Galaxy Bitcoin ETF (CBOE: BTCO) shows a clear downward channel, with the price recently bouncing from the $81.93 support level. The current price of $88.88, down 1.55% on the day, is above the 10-day SMA of $87.96 but below the 20-day ($92.14) and 30-day ($95.36) SMAs. The RSI of 43.14 indicates potential bullish momentum building after bouncing from oversold conditions. The MACD, although negative, shows early signs of a potential reversal with a bottoming pattern in the histogram.
Our prediction of a bounce at the $81.93 support level has proven accurate, with the price increasing approximately 8.5% from that level. Looking ahead, key resistance levels are at $92.14 (20-day SMA) and the upper boundary of the downtrend channel around $95-97. A break above these levels would be necessary for sustained upside movement.
The short-term outlook is bullish due to the bounce from support, but the medium-term trend remains within a downtrend channel. Critical levels to watch for continued upside are the 20-day SMA at $92.14 and a potential breakout above the descending channel.
Disclaimer:
Sahm is subject to the supervision and control of the CMA, pursuant to its license no. 22251-25 issued by CMA.
The Information presented above is for information purposes only, which shall not be intended as and does not constitute an offer to sell or solicitation for an offer to buy any securities or financial instrument or any advice or recommendation with respect to such securities or other financial instruments or investments. When making a decision about your investments, you should seek the advice of a professional financial adviser and carefully consider whether such investments are suitable for you in light of your own experience, financial position and investment objectives. The firm and its analysts do not have any material interests or conflicts of interest in any companies mentioned in this report.
Performance data provided is accurate and sourced from reliable platforms, including Argaam, TradingView, MarketWatch.
IN NO EVENT SHALL SAHM CAPITAL FINANCIAL COMPANY BE LIABLE FOR ANY DAMAGES, LOSSES OR LIABILITIES INCLUDING WITHOUT LIMITATION, DIRECT OR INDIRECT, SPECIAL, INCIDENTAL, CONSEQUENTIAL DAMAGES, LOSSES OR LIABILITIES, IN CONNECTION WITH YOUR RELIANCE ON OR USE OR INABILITY TO USE THE INFORMATION PRESENTED ABOVE, EVEN IF YOU ADVISE US OF THE POSSIBILITY OF SUCH DAMAGES, LOSSES OR EXPENSES.
