Strong week for Universal Electronics (NASDAQ:UEIC) shareholders doesn't alleviate pain of five-year loss
Universal Electronics Inc. UEIC | 10.72 | -1.56% |
Universal Electronics Inc. (NASDAQ:UEIC) shareholders should be happy to see the share price up 11% in the last week. But that doesn't change the fact that the returns over the last half decade have been stomach churning. Indeed, the share price is down a whopping 83% in that time. So we don't gain too much confidence from the recent recovery. The million dollar question is whether the company can justify a long term recovery. While a drop like that is definitely a body blow, money isn't as important as health and happiness.
The recent uptick of 11% could be a positive sign of things to come, so let's take a look at historical fundamentals.
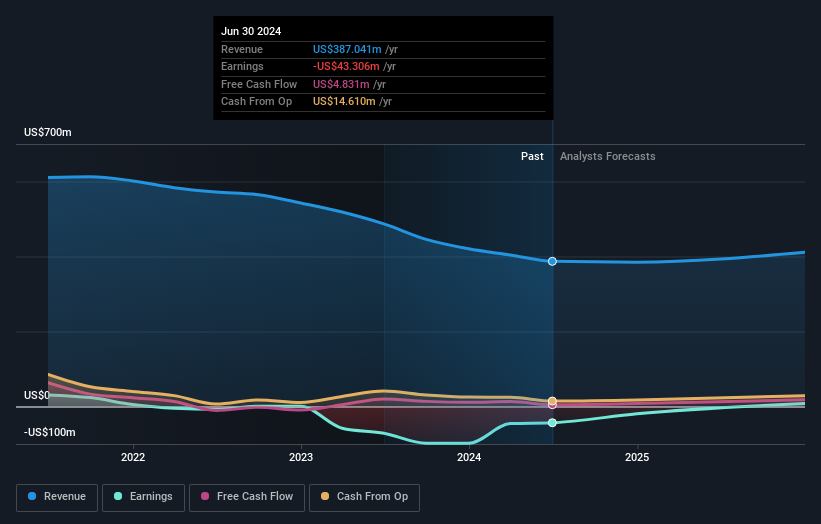
Given that Universal Electronics didn't make a profit in the last twelve months, we'll focus on revenue growth to form a quick view of its business development. Generally speaking, companies without profits are expected to grow revenue every year, and at a good clip. That's because it's hard to be confident a company will be sustainable if revenue growth is negligible, and it never makes a profit.
In the last five years Universal Electronics saw its revenue shrink by 12% per year. That's definitely a weaker result than most pre-profit companies report. So it's not that strange that the share price dropped 13% per year in that period. This kind of price performance makes us very wary, especially when combined with falling revenue. Of course, the poor performance could mean the market has been too severe selling down. That can happen.
You can see below how earnings and revenue have changed over time (discover the exact values by clicking on the image).

This free interactive report on Universal Electronics' balance sheet strength is a great place to start, if you want to investigate the stock further.
A Different Perspective
Universal Electronics shareholders gained a total return of 12% during the year. But that was short of the market average. On the bright side, that's still a gain, and it is certainly better than the yearly loss of about 13% endured over half a decade. So this might be a sign the business has turned its fortunes around. Shareholders might want to examine this detailed historical graph of past earnings, revenue and cash flow.
If you are like me, then you will not want to miss this free list of undervalued small caps that insiders are buying.
Please note, the market returns quoted in this article reflect the market weighted average returns of stocks that currently trade on American exchanges.
This article by Simply Wall St is general in nature. We provide commentary based on historical data and analyst forecasts only using an unbiased methodology and our articles are not intended to be financial advice. It does not constitute a recommendation to buy or sell any stock, and does not take account of your objectives, or your financial situation. We aim to bring you long-term focused analysis driven by fundamental data. Note that our analysis may not factor in the latest price-sensitive company announcements or qualitative material. Simply Wall St has no position in any stocks mentioned.


