
Understand the exponential moving average (EMA)
The Exponential Moving Average (EMA) is a technical indicator used in trading practices that shows how the price of an asset or security changes over a certain period of time. An exponential moving average places a greater weight and significance on the most recent data points compared to the simple moving average. The aim of all moving averages is to establish the direction in which the price of a security is moving based on past prices. Thus, exponential moving averages are lag indicators. They are not predictive of future prices, and they simply highlight the trend that is being followed by the asset price.
Calculating the Exponential Moving Average
The formula for calculating the EMA is as follows:
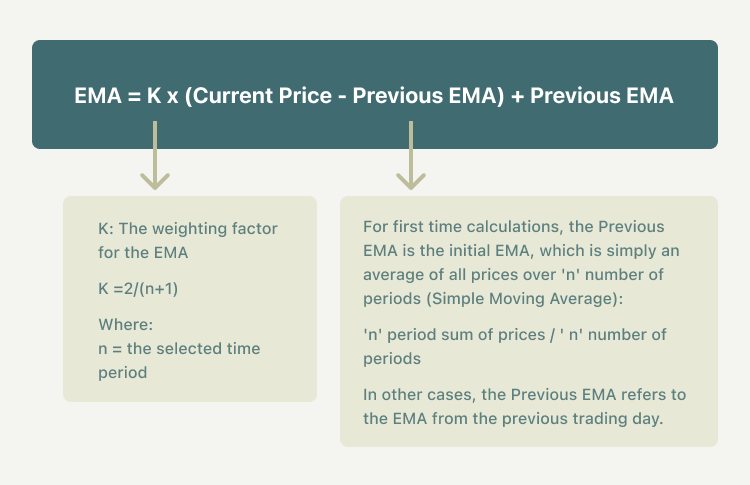
As exemplified in the chart above, EMAs calculated over a fewer number of periods (i.e., based on more recent prices) show a higher weightage than those calculated over longer periods. It can be shown by calculating the value of “K” for two different time periods:
- The weighting factor for a 21-day EMA:
K21= 2/(21+1) = 0.09= 9.0%
- The weighting factor for a 100-day EMA:
K100= 2/(100+1)= 0.019= 1.9%
The weighting given to the most recent price is greater for a shorter-period EMA than for a longer-period EMA. For example, a 9% multiplier is applied to the most recent price data for a 21-period EMA, while the weight is only 1.9% for a 100-period EMA.
The 21-day EMA places a 9.0% weight on the most recent price, whereas the 100-day EMA only places a 1.9% weight. Therefore, EMAs calculated over shorter periods are more responsive to price changes than those calculated over longer periods.
Exponential Moving Average vs Simple Moving Average
The primary difference between an EMA and a SMA is the sensitivity each one shows to changes in the data used in its calculation. SMA calculates the average price data, while EMA gives more weight to current data. The newest price data will impact the moving average more, with older price data having a lesser impact. More specifically, the exponential moving average gives a higher weighting to recent prices, while the simple moving average assigns an equal weighting to all values.
When traders want a moving average that will respond to the price action rather quickly, a short period EMA is the best way to go. These can help them catch trends very early, which will result in higher profit. In fact, the earlier you catch a trend, the longer you can ride it and gain more profits. Instead, when traders want a moving average that is smoother and slower to respond to price action, a longer period SMA is the best way to go. This would work well when looking at longer time frames, as it could give you an idea of the overall trend.
Exponential moving average trading strategies
- Use the same rules that apply to SMA when interpreting EMA. Keep in mind that EMA is generally more sensitive to price movement. However, this can be a double-edged sword. On one side, it can help you identify trends earlier than an SMA would. On the flip side, the EMA will probably experience more short-term changes than a corresponding SMA.
- Use the EMA to determine the trend direction and trade in that direction. When the EMA rises, you may want to consider buying when prices dip near or just below the EMA. When the EMA falls, you may consider selling when prices rally towards or just above the EMA.
- Moving averages can also indicate support and resistance areas. A rising EMA tends to support the price action, while a falling EMA tends to provide resistance to price action. This reinforces the strategy of buying when the price is near the rising EMA and selling when the price is near the falling EMA.
- All moving averages, including the EMA, are not designed to identify a trade at the exact bottom or top. Moving averages may help you trade in the general direction of a trend, but with a delay at the entry and exit points. The EMA has a shorter delay than the SMA with the same period.
Summary:
- The Exponential Moving Average (EMA) is a technical indicator used in trading practices that shows how the price of an asset or security changes over a certain period of time.
- An exponential moving average places a greater weight and significance on the most recent data points compared to the simple moving average.
- An exponential moving average can be a double-edged sword. On one side, it can help you identify trends earlier than an SMA would. On the flip side, the EMA will probably experience more short-term changes than a corresponding SMA.
- When the EMA rises, you may want to consider buying when prices dip near or just below the EMA. When the EMA falls, you may consider selling when prices rally towards or just above the EMA.
- A rising EMA tends to support the price action, while a falling EMA tends to provide resistance to the price action. This reinforces the strategy of buying when the price is near the rising EMA and selling when the price is near the falling EMA.
