Saudi Market
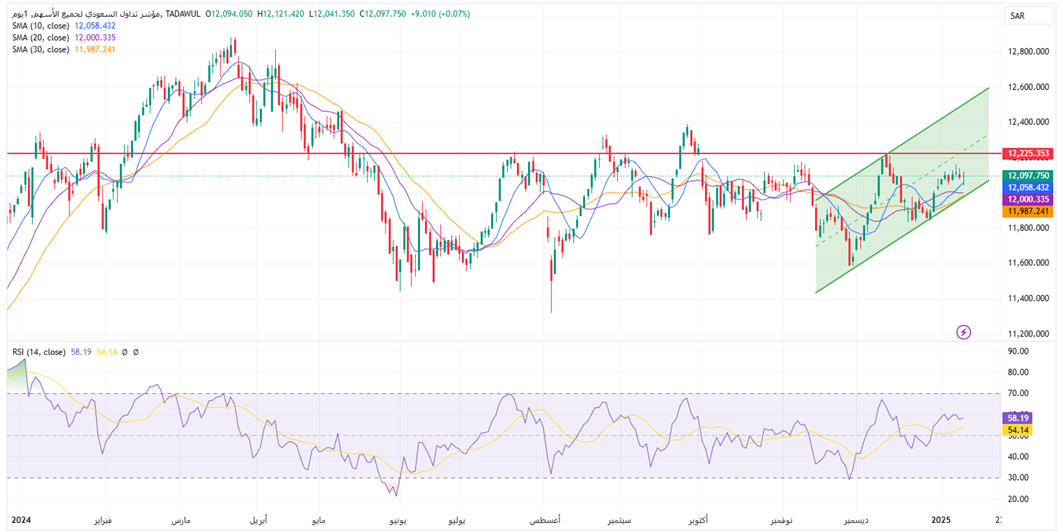
TASI Technical Analysis:
Tasi is currently in an upward channel, with SMA 10 crossing SMA 20 upward, which is generally seen as a strong buy signal. The current market trend shows a strong upward trend, with prices fluctuating above multiple moving averages. Tasi is currently in an ascending channel (green area) with a resistance level of 12225.35.
The RSI value is 58.19, close to 60, which indicates that the market is currently in a relatively balanced state, with no obvious overbought or oversold signals. Investors should pay attention to whether the RSI can enter the overbought area, which may be a signal of a market trend shift.
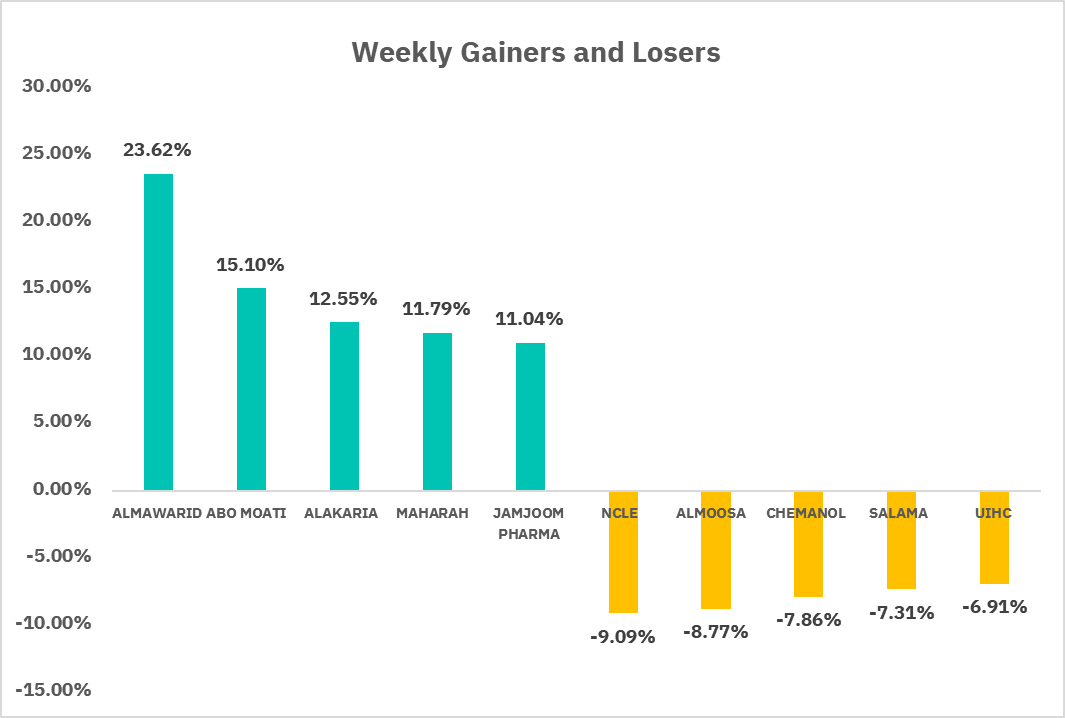
TASI Index Weekly Market Summary (January 5, 2025 to January 9, 2025)
The TASI index closed up 0.23% last week, showing an upward trend, especially on January 7, when it rose to the highest point of the week at 12,113 points. Although it fell slightly, it continued to rise on January 8 and January 9. The average daily turnover is 0.454million Saudi Riyals (SAR), Market liquidity remained stable last week. In terms of individual stock performance, 143 companies saw their share prices rise, while 111 companies experienced declines. ALMAWARID and ABO MOATI were the top gainers, with gains of 23.62% and 15.10%. Conversely, ALMOOSA, which was just listed last week, fell as much as 8.77%.
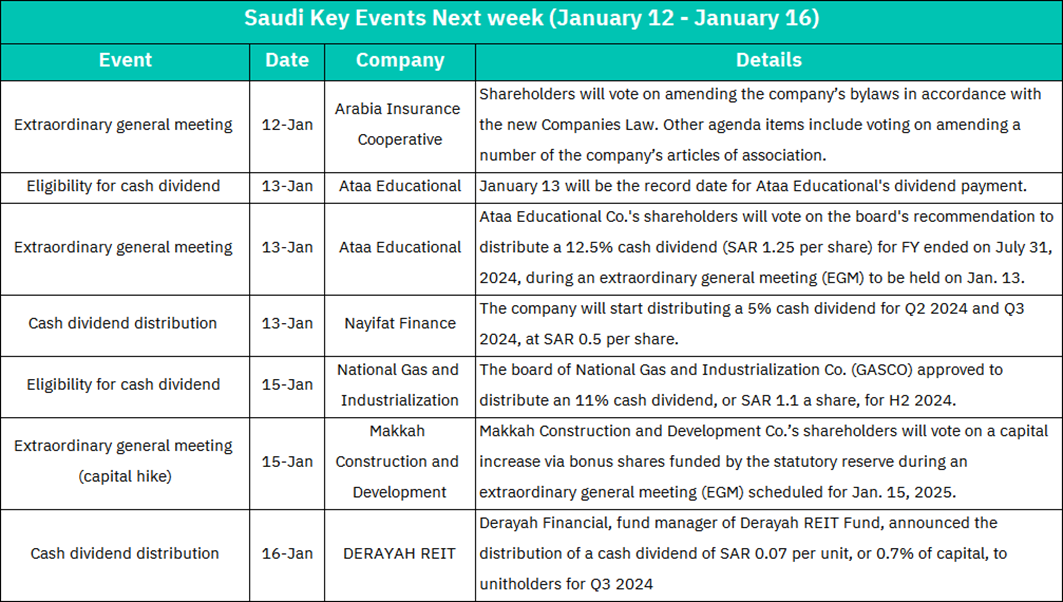
1. January 12: Arabia Insurance Cooperative will hold an extraordinary general meeting of shareholders, where shareholders will vote to amend the company's articles of association to comply with the new company law. In addition, a vote will be held to amend some of the company's articles of association. Amendments to the articles of association may affect the company's operations and governance structure, and investors need to pay attention to whether these changes are in line with their investment expectations and risk preferences.
2. January 13: Ataa Educational will hold an Extraordinary General Meeting of Shareholders where shareholders will vote on whether to distribute a 12.5% cash dividend (SAR 1.25 per share) as recommended by the Board of Directors. If the dividend distribution goes through, January 13 will be the record date for Ataa Educational's dividend payment.
Nayifat Finance will begin distributing a 5% cash dividend of 0.5 SAR per share for the second and third quarters of 2024.
3. January 15: The Board of Directors of National Gas and Industrialization (GASCO) approved the distribution of an 11% cash dividend of SAR 1.1 per share for the second half of 2024. Makkah Construction and Development will hold an extraordinary general meeting of shareholders where shareholders will vote on whether to increase capital through bonus shares from statutory reserve funds.
4. January 16: Derayah Financial, as the manager of the Derayah REIT fund, declared a cash dividend of SAR 0.07 per unit, or 0.7% of capital, to unitholders for the third quarter of 2024.
U.S. Market
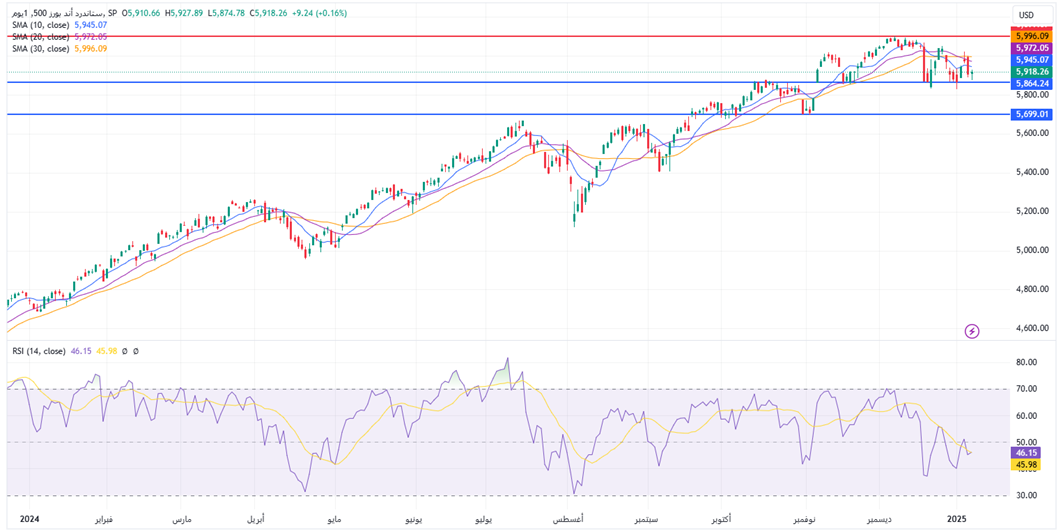
S&P500 Technical Analysis:
The S&P 500 decreased by 0.41%, the current value of SMA 10 is 5,945.07, which is slightly higher than the current price of 5,918.26, indicating that there is a downward pressure on the market in the short term. The SMA 20 crossed over the SMA 30 downwards, which could be a bearish sign indicating that the price might continue to fall in the mid-term. The support level is at 5,864 and if the price falls below this level, it is likely to fall further. RSI 14 is 46.15, indicating that the market is in a neutral to weak state, with no obvious overbought or oversold signals. Last week, federal government officials said that due to persistent inflation, the U.S. economy is still growing and fiscal policy uncertainty, the pace of future interest rate cuts will slow down. Some participants believed that the Fed should maintain the target range of the federal funds rate unchanged. They pointed out that the risk of continued inflation has increased in recent months. Several participants emphasized that in order to create a financial environment that allows inflation to continue to fall back to 2%, it is necessary for the Fed to achieve this through monetary policy.
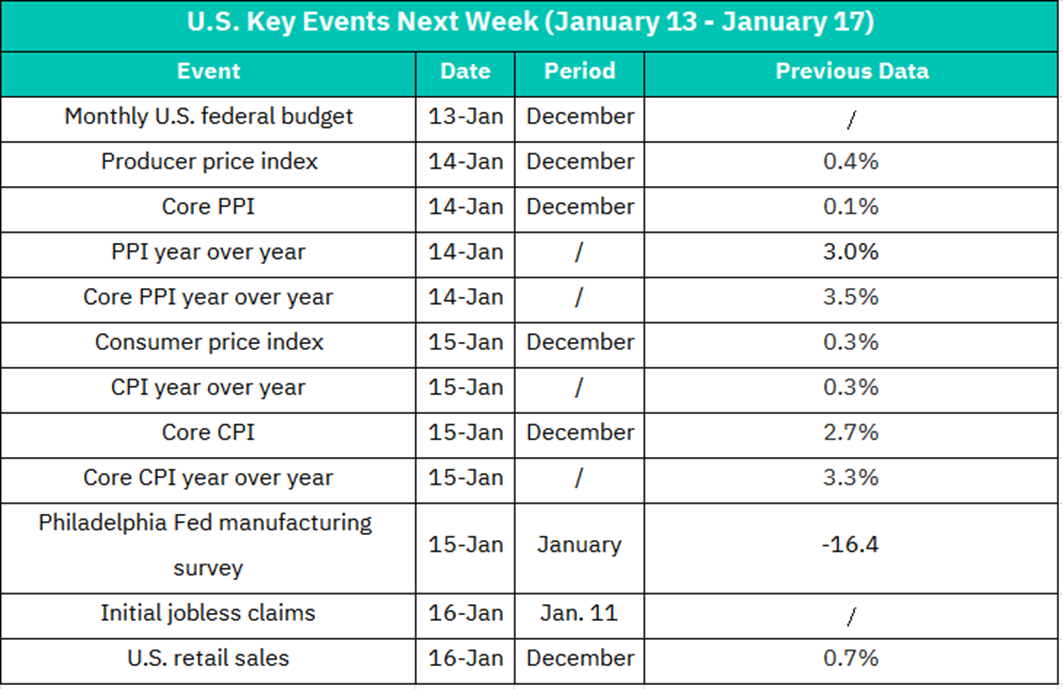
1. US Federal Budget - January 13: The US Federal Budget data for December will be released. This report will reveal details of government spending and revenue, which is critical to understanding the government's fiscal position and future fiscal policy. The market may react to the size and trend of the budget deficit, especially if the data differs significantly from expectations.
2. Producer Price Index (PPI) - January 14: The Producer Price Index for December will be released, including the headline PPI and the core PPI (excluding food and energy prices). PPI is an indicator of price changes at the producer level and plays an important role in predicting future consumer price inflation. If PPI is higher than expected, it may trigger market concerns about rising inflation.
3. Consumer Price Index (CPI) -January 15: The Consumer Price Index for December will be released, including the headline CPI and the core CPI. CPI is an indicator of price changes when consumers buy goods and services, and is one of the key data considered by the Federal Reserve when formulating monetary policy. A higher-than-expected CPI may increase market expectations for the Federal Reserve to raise interest rates.
4. Philadelphia Fed Manufacturing Survey - January 15: The Philadelphia Fed Manufacturing Survey for January will be released. This survey provides real-time data on manufacturing activity and is important for assessing the health of the manufacturing sector and overall economic activity. If the data is strong, it may boost the stock market and the US dollar.
5. Initial Jobless Claims - January 16: Initial Jobless Claims for the week ended January 11 will be released. This is a key measure of labor market conditions and is critical to assessing the health of the economy. If the number of unemployment claims is lower than expected, it may indicate that the labor market remains strong.
6. US Retail Sales - January 16: Retail sales data for December will be released. Retail sales are an important measure of consumer spending and are important for assessing economic activity and growth potential. If the retail sales data is strong, it may indicate that consumers are more confident and willing to spend, which is good news for stocks and the US dollar.
Disclaimer:
Sahm is subject to the supervision and control of the CMA, pursuant to its license no. 22251-25 issued by CMA.
The Information presented above is for information purposes only, which shall not be intended as and does not constitute an offer to sell or solicitation for an offer to buy any securities or financial instrument or any advice or recommendation with respect to such securities or other financial instruments or investments. When making a decision about your investments, you should seek the advice of a professional financial adviser and carefully consider whether such investments are suitable for you in light of your own experience, financial position and investment objectives. The firm and its analysts do not have any material interests or conflicts of interest in any companies mentioned in this report.
Performance data provided is accurate and sourced from reliable platforms, including Argaam, TradingView, MarketWatch.
IN NO EVENT SHALL SAHM CAPITAL FINANCIAL COMPANY BE LIABLE FOR ANY DAMAGES, LOSSES OR LIABILITIES INCLUDING WITHOUT LIMITATION, DIRECT OR INDIRECT, SPECIAL, INCIDENTAL, CONSEQUENTIAL DAMAGES, LOSSES OR LIABILITIES, IN CONNECTION WITH YOUR RELIANCE ON OR USE OR INABILITY TO USE THE INFORMATION PRESENTED ABOVE, EVEN IF YOU ADVISE US OF THE POSSIBILITY OF SUCH DAMAGES, LOSSES OR EXPENSES.


