
What is technical analysis?
Technical analysis is a method used to predict future price movement of a security by analyzing statistical trends gathered from trading activity, such as price movement and volume. Technical analysts believe past trading activity and price changes of a security can be valuable indicators of its future price movements.
The field of technical analysis is based on three assumptions:
1. The market discounts everything
Technical analysis assumes that, at any given time, a stock's price reflects everything that has affected or could affect the company - including fundamental factors. Technical analysts believe that the company's fundamentals, along with broader economic factors and market psychology, are all priced into the stock, which removes the need to actually consider these factors separately. This only leaves the analysis of price movement, which technical theory views as a product of the supply and demand for a particular stock in the market.
2. Price moves in trends
In technical analysis, price movements are believed to follow trends. This means that after a trend is established, the future price movement is more likely to be in the same direction as the trend than to be against it. Most technical trading strategies are based on this assumption.
3. Price action is repetitive, with certain patterns reoccurring
Another important idea in technical analysis is that history tends to repeat itself, mainly in terms of price movement. The repetitive nature of price movements is attributed to market psychology; in other words, market participants tend to provide a consistent reaction to similar market stimuli over time. Technical analysis uses chart patterns to analyze market movements and understand trends. Although many of these charts have been used for more than 100 years, they are still believed to be relevant now because they illustrate patterns in price movements that often repeat themselves.
The primary tools used in technical analysis are charts and indicators. Charts are graphical displays of price and volume data. Indicators are approaches to analyzing the charts. While the tools can be used on a standalone basis, many analysts and investors will find added value in combining the techniques of chart analysis with their own research and investment approach.
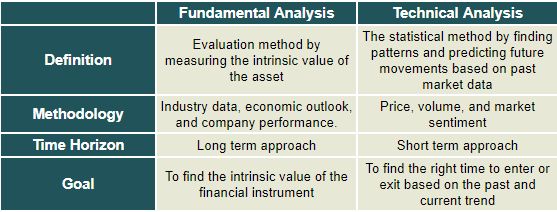
Technical Analysis V.S. Fundamental Analysis
Technical analysis is contrasted with fundamental analysis, which focuses on a company's financials rather than historical price patterns and volume. There are some differences between fundamental and technical analysis:
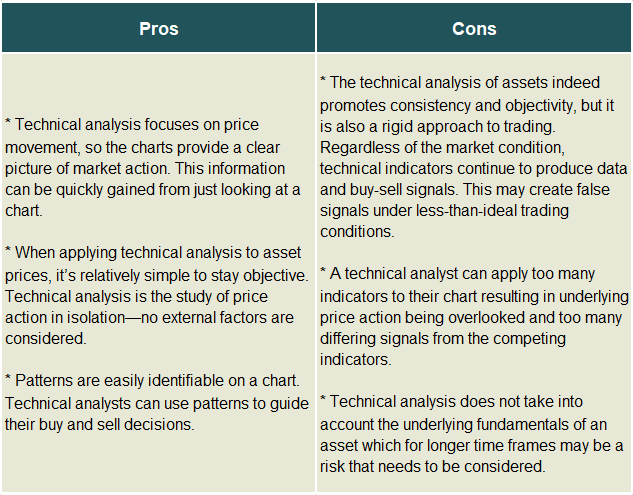
Pros & cons of technical analysis
Technical analysis is a robust tool for timing purchases and sales but unlike fundamental analysis, it is not much used for estimating the real value of an asset. However, a criticism of technical analysis is that history does not repeat itself exactly, so price pattern study is of dubious importance and can be ignored. Here are the pros and cons of technical analysis:
Summary:
- Technical analysis is a method used to predict future price movement of a security by analyzing statistical trends gathered from trading activity, such as price movement and volume.
- Technical analysis has three main principles and assumptions: The market discounts everything, prices move in trends, and price action is repetitive.
- The primary tools used in technical analysis are charts and indicators. Charts are graphical displays of price and volume data. Indicators are approaches to analyzing the charts.
- Technical analysis and fundamental analysis are the two main schools of thought in the financial markets. Technical analysis looks at the price movement of a security and uses this data to predict its future price movements. Fundamental analysis, on the other hand, looks at economic factors and others.
- When applying technical analysis to asset prices, it’s relatively simple to stay objective. Technical analysis is the study of price action in isolation—no external factors are considered.
- However, the technical analysis of assets indeed promotes consistency and objectivity, but it is also a rigid approach to trading. Regardless of the market condition, technical indicators continue to produce data and buy-sell signals. This may create false signals under less-than-ideal trading conditions.
