
What are support and resistance levels?
Technical analysts use support and resistance levels to identify price points on a chart where the probabilities favor a pause or reversal of a prevailing trend. It is crucial when determining market psychology and supply and demand. When these support or resistance levels are broken, the supply and demand forces that created these levels are assumed to have moved, in which case new levels of support and resistance will likely be established.
What is support?
The support level is where the price regularly stops falling and bounces back up. In a downtrend, prices fall because there is an excess of supply over demand. The lower prices go, the more attractive prices become to those waiting on the sidelines to buy the assets. At some level, demand that would have been slowly increasing will rise to the level where it matches supply. At this point, prices will stop falling.
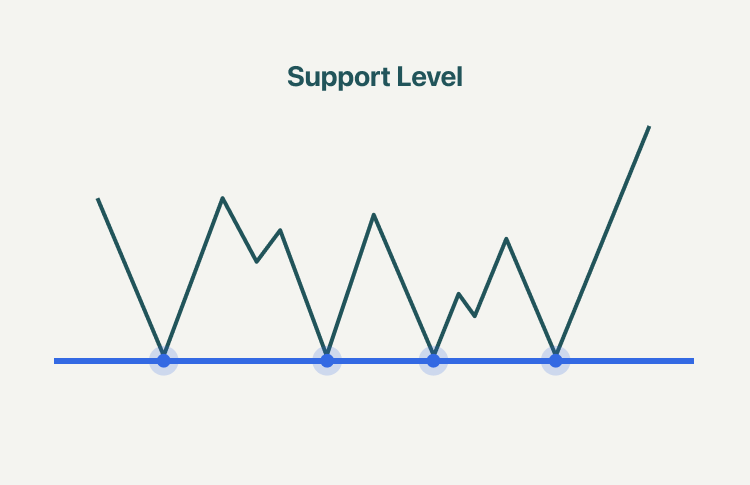
Support can be a price level on the chart or a price zone. In any event, support is an area on a price chart that shows buyers’ willingness to buy. It is at this level that demand will usually overwhelm supply, causing the price decline to halt and reverse.
What is resistance?
Resistance is the price at which the price of an asset meets pressure on its way up by the emergence of a growing number of sellers who wish to sell at that price. The logic behind resistance is that more sellers have entered the market than buyers. Thus, the price of an asset is no longer upwards, but downward.
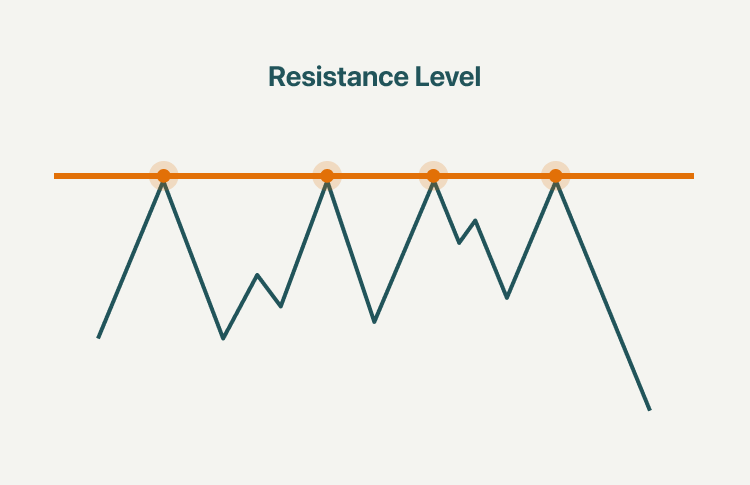
Resistance is the level at which supply is strong enough to stop the stock from moving higher. In the image above you can see that each time the price reaches the resistance level, it has a hard time moving higher. The rationale is that as the price rises and approaches resistance, sellers (supply) become more inclined to sell and buyers (demand) become less willing to buy.
Support and resistance reversal
A key concept of technical analysis is that when a resistance or support level is broken, its role is reversed. As seen below:
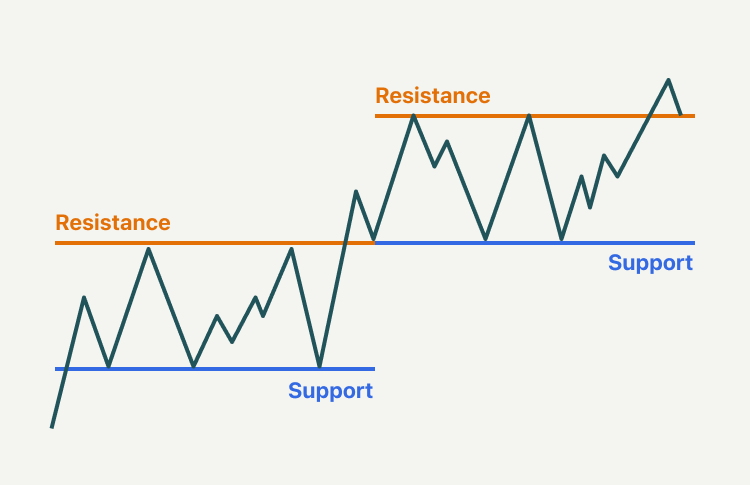
If the price falls below a support level, that level will become resistance. If the price rises above a resistance level, it will often become support. As the price moves past a level of support or resistance, it is thought that supply and demand has shifted, causing the breached level to reverse its role.
The more often a price hits either level, the more reliable that level is likely to be in predicting future price movements. It often happens that both levels become psychological barriers for traders, as they tend to buy or sell once a level is reached.
Support and resistance trading strategy
1. Range trading
A trading range occurs when a security trades between consistent high and low prices for a period of time. The top of a security’s trading range often provides price resistance, while the bottom of the trading range typically offers price support. As seen below:
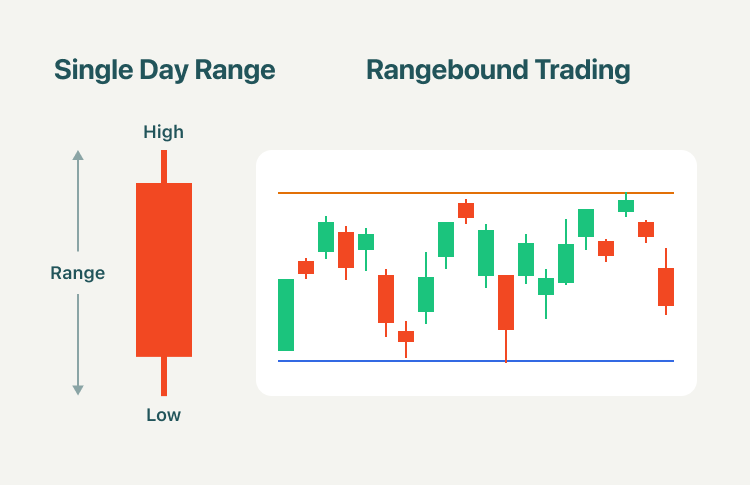
The image above are areas where support and resistance levels are relatively close and price bounces between two levels for a period of time. Experienced traders will sometimes trade within these trading ranges, which are also known as sideways trends. One strategy that they use is to place short trades as the price touches the upper trendline and long trades as price reverses to touch the lower trendline.
2. Breakout strategy
Another strategy used in support and resistance trading is the breakout strategy. A breakout is an asset price moving outside a defined support or resistance level with increased volume.
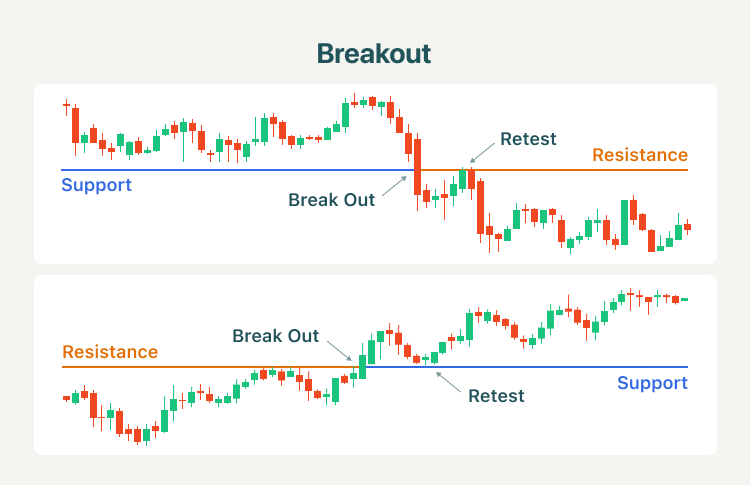
Usually, a breakout trader enters a long position after the asset price breaks above resistance or enters a short position after the asset breaks below support.
3. Trending line strategy
The trendline strategy utilizes the trendline as either support or resistance. Simply draw a line connecting two or more highs in a downtrend, or two or more lows in an uptrend. As shown below:
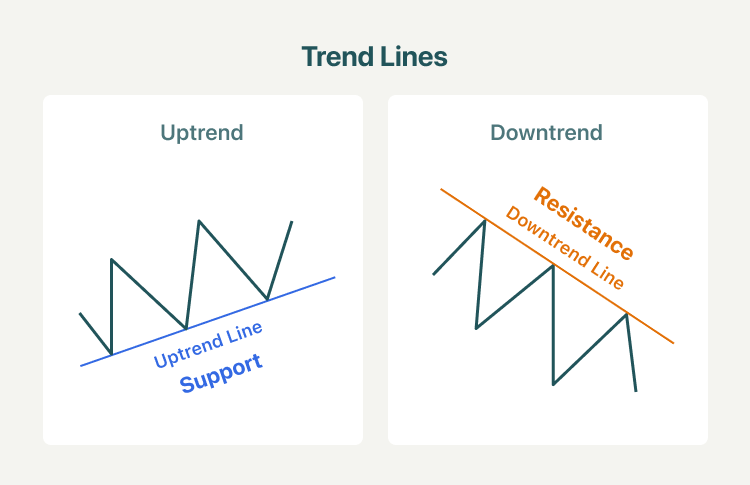
Technical traders pay close attention to an asset when the price approaches a trendline because these areas often play a major role in determining the short-term direction of the asset's price. As the price nears a major support/resistance level, there are two different scenarios that can occur: The price will bounce off the trendline and continue in the direction of the prior trend, or it will move through the trendline, which can then be used as a sign that the current trend is reversing or weakening. Thus, this information can be very useful to traders looking for strategic entry levels or can even be used to effectively manage risk, by identifying areas to place stop-loss orders.
Summary:
- Technical analysts use support and resistance levels to identify price points on a chart where the probabilities favor a pause or reversal of a prevailing trend.
- The support level is where the price regularly stops falling and bounces back up.
- Resistance is the price at which the price of an asset meets pressure on its way up by the emergence of a growing number of sellers who wish to sell at that price.
- A key concept of technical analysis is that when a resistance or support level is broken, its role is reversed.
- A trading range occurs when a security trades between consistent high and low prices for a period of time. The top of a security’s trading range often provides price resistance, while the bottom of the trading range typically offers price support.
- Another strategy used in support and resistance trading is the breakout strategy. A breakout is an asset price moving outside a defined support or resistance level with increased volume.
- The trendline strategy utilizes the trendline as either support or resistance. Simply draw a line connecting two or more highs in a downtrend, or two or more lows in an uptrend.
- As the price nears a major support/resistance level, there are two different scenarios that can occur: The price will bounce off the trendline and continue in the direction of the prior trend, or it will move through the trendline, which can then be used as a sign that the current trend is reversing or weakening.
