
What is the relative strength index (RSI)?
The Relative Strength Index (RSI) is a momentum indicator used in technical analysis, developed by J. Welles Wilder. RSI measures the speed and magnitude of an asset's recent price changes to evaluate overvalued or undervalued asset price conditions. The RSI oscillates between zero and 100. Traditionally the RSI is considered overbought when above 70 and oversold when below 30. It can also indicate assets that may be primed for a trend reversal or corrective pullback in price and when to buy and sell.
RSI calculation
To make this RSI calculation explanation simpler, let’s first break RSI down into its most basic components: RS, Average Gain and Average Loss. This RSI calculation is based on 14 periods, which is the default suggested by Welles Wilder. Losses are reported as positive values, rather than negative values.
The first calculations for average gain and average loss are simple 14-period averages:
- Average Gain = Sum of Gains over the past 14 periods / 14
- Average Loss = Sum of Losses over the past 14 periods / 14
The next step is to calculate RS (Relative Strength). To do this, you take the average gain and divide it by the average loss.
- RS = Average Gain / Average Loss
Finally, you apply the RS value to the RSI formula to get your final answer.
- Relative Strength Index = 100 – 100 / (1 + RS)
The resulting number will oscillate between 0 and 100. Traditionally, the Relative Strength Index is considered to signal overbought conditions when above 70 and oversold conditions when under 30. The levels can be adjusted, however, to better fit the price movement of a specific asset a trader is watching. For example, if an asset’s RSI consistently hits above the 70 mark or below the 30 mark without correctly forecasting a change in price trend, a trader might adjust the upper end to 80 and/or the lower end to 20 to get more reliable trading signals.
RSI trading strategies
- Overbought signal
RSI indicator is expressed as a value between 0 and 100. When the indicator reading approaches the upper end of this range is above 70, and the security in question is said to be overbought. An overbought signal is a suggestion that the short-term gains in a particular market may be reaching a point of maturity. For instance, the rally that took the price higher may be nearing a short-term end and possibly readying for a near-term decline. Thus, a trader who is long might consider using the overbought signal as a signal to lock in profit and exit the trade he/she may already be in. Also, a trader who has no open positions might consider using the overbought signal as a signal to enter a new trade 'short'.
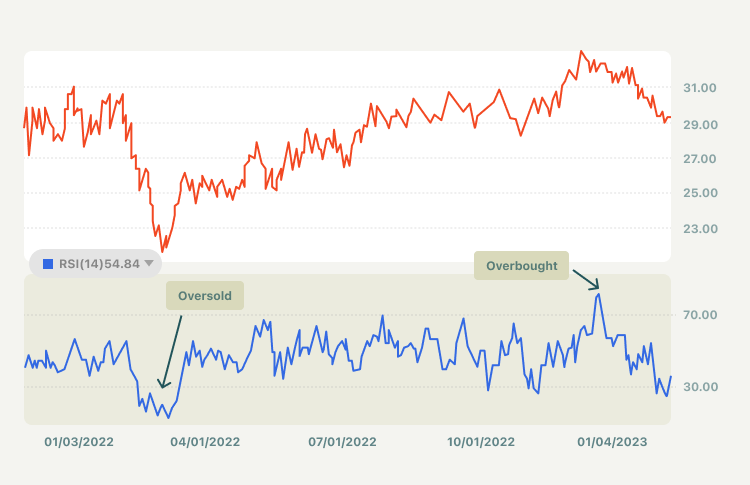
- Oversold signal
When the RSI indicator value approaches the lower end of the 0 to 100 range below 30, the asset in question is said to be "oversold." An oversold signal is the suggestion that the short-term declines in a particular market may be reaching a point of maturity. For example, the decline which took the price lower may be nearing a short-term end and possibly readying for a near-term rebound to follow. Therefore, a trader who has no open positions might consider using the oversold signal as a signal to enter a new trade "long," thereby entering the market with a buy as the expectation is that the price will rise in the near term. Additionally, a trader who has already sold short in the market may consider using the oversold signal as a signal to lock in profit (if the price has fallen) and exit the trade with a buy. - RSI divergence
A divergence signal with the RSI is considered when the highs or lows of the market price are moving in different directions from the highs or lows on the RSI indicator. For a positive divergence, we look at the lows of both the price and the indicator. If the price is making higher lows, and the indicator is making lower lows, a positive or bullish divergence signal is considered. A positive divergence signal in conjunction with an oversold signal is considered by many market technicians to be a more powerful 'buy' signal than an oversold signal in isolation.
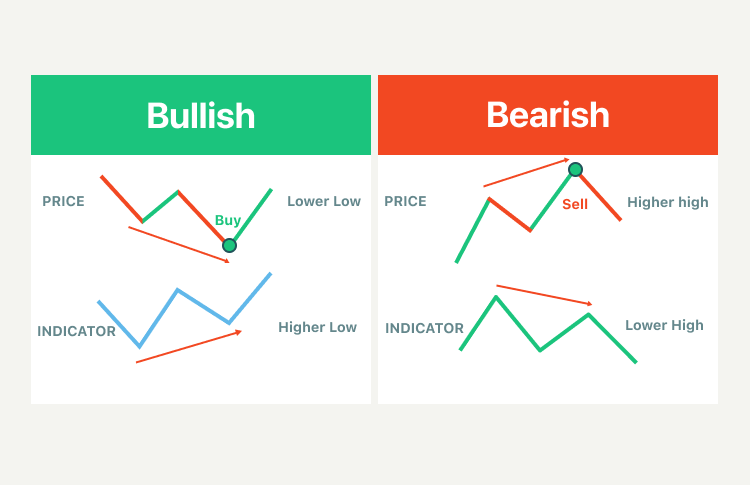
For a bearish divergence, we look at the highs of both the price and the indicator. If the price is making higher highs, and the indicator is making lower highs, a bearish divergence signal is considered. It is preferable to witness this occur when the RSI is in overbought territory. A bearish divergence suggests a short-term decline in the securities price to follow. A bearish divergence signal in conjunction with an overbought signal is considered by many market technicians to be a more powerful 'sell' signal than just an overbought signal in isolation.
Summary:
- The Relative Strength Index (RSI) measures the speed and magnitude of an asset's recent price changes to evaluate overvalued or undervalued asset price conditions.
- Traditionally, the Relative Strength Index is considered to signal overbought conditions when above 70 and oversold conditions when under 30. The levels can be adjusted, however, to better fit the price movement of a specific asset a trader is watching.
- RSI indicator is expressed as a value between 0 and 100. When the indicator reading approaches the upper end of this range which is above 70, and the security in question is said to be overbought. An overbought signal is the suggestion that the short-term gains in a particular market may be reaching a point of maturity.
- When the RSI indicator value approaches the lower end of the 0 to 100 range below 30, the asset in question is said to be 'oversold'. An oversold signal is the suggestion that the short-term declines in a particular market may be reaching a point of maturity.
- A divergence signal with the RSI is considered when the highs or lows of the market price are moving in different directions from the highs or lows on the RSI indicator.
- A positive divergence signal in conjunction with an oversold signal is considered by many market technicians to be a more powerful 'buy' signal than an oversold signal in isolation.
- A bearish divergence signal in conjunction with an overbought signal is considered by many market technicians to be a more powerful 'sell' signal than just an overbought signal in isolation.
