
What is a double top pattern?
A double top is a bearish technical reversal pattern that forms after an asset reaches a high price two consecutive times with a moderate decline between the two highs. The pattern has an “M” shape, as seen below:
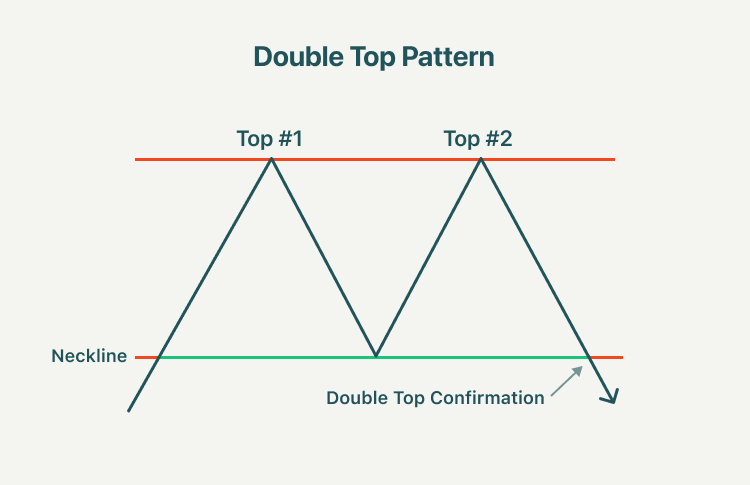
As the image above shows, the double top pattern is made up of two peaks above a support level, known as the neckline. The first peak will come immediately after a strong bullish trend, and it will retrace to the neckline. Once it hits this level, the momentum will shift to bullish once again to form the second peak. If a double top occurs, the second peak will usually be slightly below the first peak indicating resistance and exhaustion. Their formation suggests that investors are seeking to obtain final profits from a longer bullish trend.
Therefore, when the double top pattern is confirmed, the trend must retrace more significantly than it did after the initial retracement following the first peak. Often, this means that the price momentum breaks through the neckline level of support, and the bearish trend continues for a medium or long period of time.
What is the double bottom pattern?
A double bottom is a bullish reversal trading pattern, which is essentially the opposite of double top patterns. The pattern looks like the letter "W." As seen below:
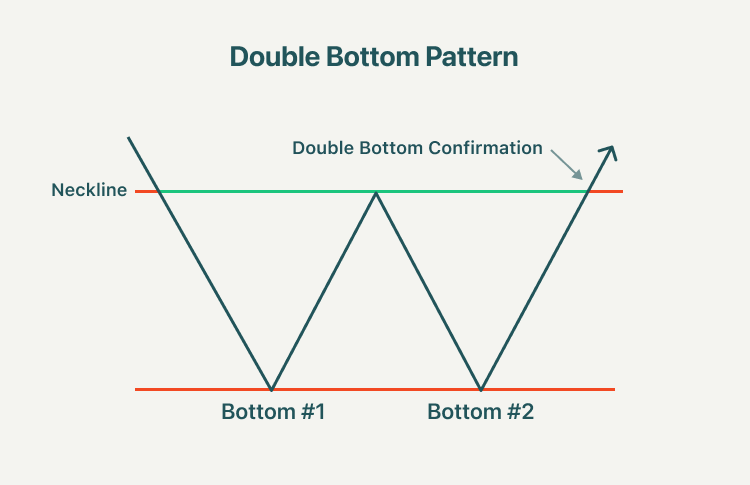
A double bottom is made up of two lows below a resistance level which – as with the double top pattern – is referred to as the neckline. The first low will come immediately after the bearish trend, but it will stop and move in a bullish retracement to the neckline, which forms the first low. Once the bullish trend has hit the neckline, it will need to rebound and enter a bearish trend once more until the momentum shifts to bullish, which will form the second low. When the second bottom is formed, the trend will need to more permanently reverse into bullish momentum.
The trend is confirmed when the bullish trend breaks through the neckline level and continues upwards. Many traders will seek to enter a long position at the second low.
How to trade on double tops and double bottoms?
1. Double top trading strategy
In the chart below you can see that two peaks were formed after a strong move up.
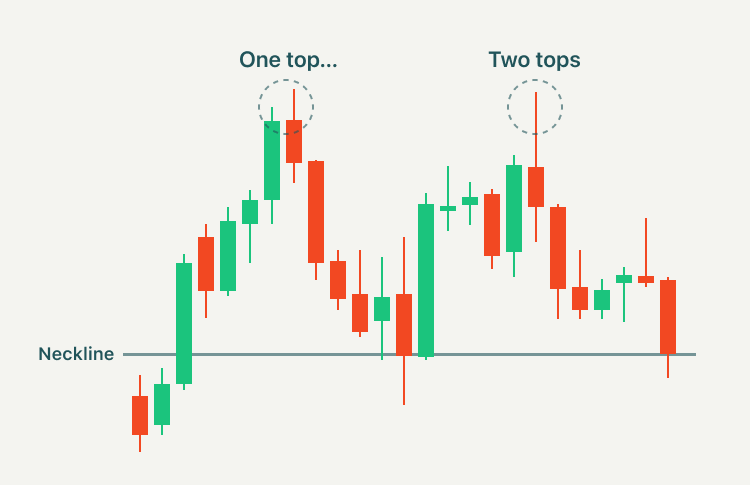
It's worth noting that the second top was not able to break the high of the first top. This is a strong sign that a reversal is going to occur because it is telling us that the buying pressure is just about finished. With the double top, we would place our entry order below the neckline because we are anticipating a reversal of the uptrend. Also, when the price touches the second top, we would place an order on a short position as a double top is a bearish technical reversal pattern.
2. Double bottom trading strategy
The double bottom is also a trend reversal formation, but this time we are looking to go long instead of short. The pattern occurs after extended downtrends when two bottoms have been formed.
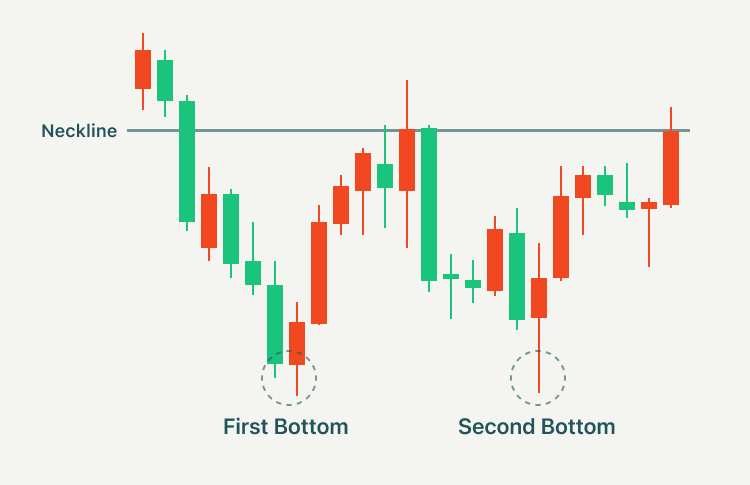
We can see from the chart above that after the previous downtrend, the price formed two valleys because it wasn’t able to go below a certain level. Also, the second bottom wasn’t able to significantly break the first bottom. This pattern is a sign that the selling pressure is about finished, and that a reversal is about to occur. Therefore, we would place an entry order when the price hits the second bottom because we are anticipating a reversal of the uptrend.
Summary:
- A double top is a bearish technical reversal pattern that forms after an asset reaches a high price two consecutive times with a moderate decline between the two highs. The pattern has an “M” shape.
- When the double top pattern is confirmed, the trend must retrace more significantly than it did after the initial retracement following the first peak. It means that the price momentum breaks through the neckline level of support, and the bearish trend continues for a medium or long period of time.
- A double bottom is a bullish reversal trading pattern, which is essentially the opposite of double top patterns. The pattern looks like the letter "W."
- A double bottom is confirmed when the bullish trend breaks through the neckline level and continues upwards. Many traders will seek to enter a long position at the second low.
- A double top is a strong sign that a reversal is going to occur because it is telling us that the buying pressure is just about finished. With the double top, we would place our entry order below the neckline because we are anticipating a reversal of the uptrend.
- When the price touches the second top, we would place an order on a short position as a double top is a bearish technical reversal pattern.
- A double bottom is a sign that the selling pressure is about finished, and that a reversal is about to occur. Therefore, we would place an entry order when the price hits the second bottom because we are anticipating a reversal of the uptrend.
