
Saudi Market
TASI Technical Analysis:
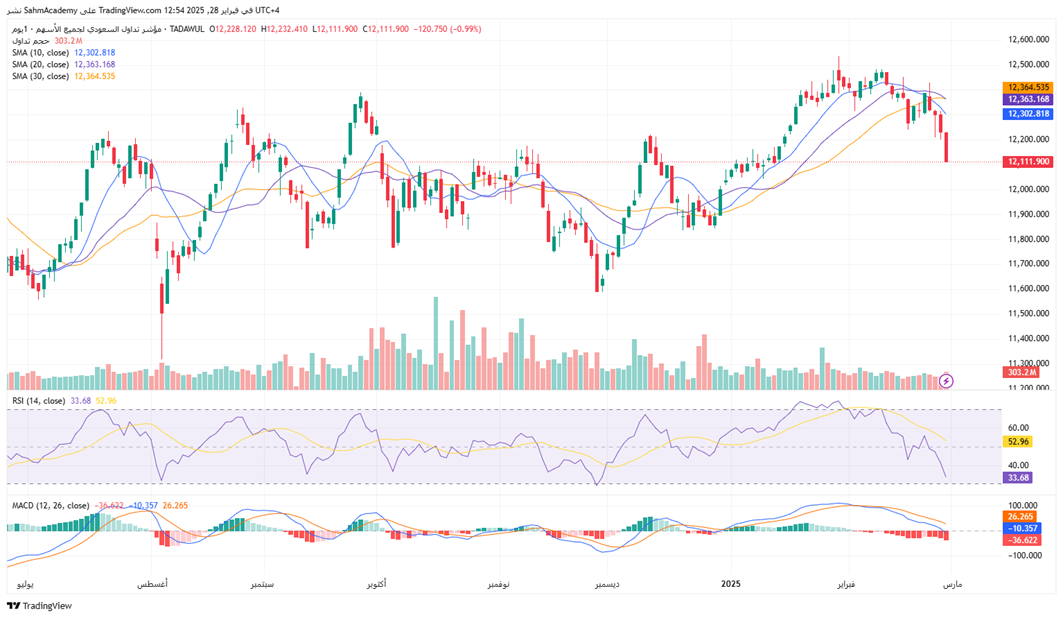
The price is currently below the 10-day moving average, the 20-day moving average and the 30-day moving average, which shows a bearish signal in the short term. If the price continues to be under pressure, it indicates that the short-term downward trend may continue.
The current value of RSI is 33.68, which is close to the oversold zone (below 30). This indicates that the market has entered an oversold state and there may be a need for a rebound. However, RSI has not completely entered the extreme oversold zone. If RSI continues to fall and approaches further below 30, it may indicate that the market still has more room to fall.
The DIFF line (fast line) and the DEA line (slow line) are both diverging downward, further confirming the strength of the short-selling force. The MACD histogram (red) also shows the market's continued selling momentum, and the negative value of the histogram continues to expand, which means that the selling pressure may continue to increase in the short term until a strong reversal signal appears.
TASI Index Weekly Market Summary (February 24 to February 28)
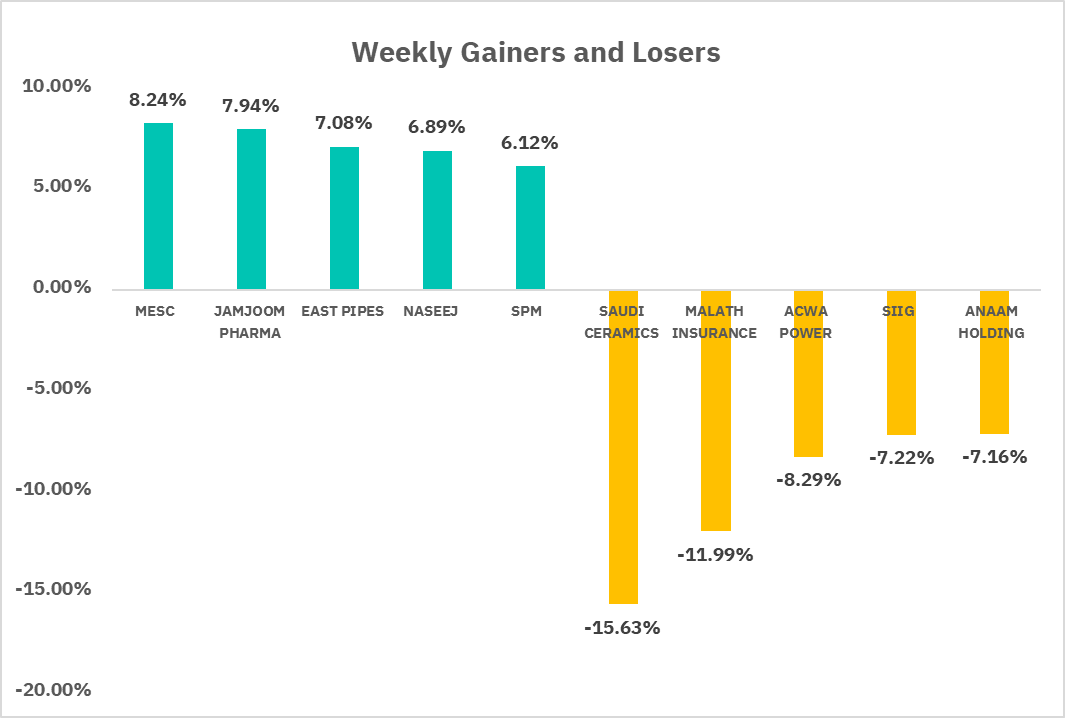
The TASI index faced a challenging week, with a 2.23% decline driven by broader market pessimism and sector-specific issues. While some companies demonstrated resilience and growth, others faced significant losses. In terms of market performance, there were 84 gainers and 176 losers. Notable gainers included MESC, which saw an 8.24% increase, and JAMJOOM PHARMA, which rose by 7.94%. On the flip side, significant losers included SAUDI CERAMICS, which declined by 15.63%, and MALATH INSURANCE, which dropped by 11.99%. Overall, the market experienced a large decline, investors should monitor macroeconomic indicators, sector trends, and corporate developments for better insights into future market movements.
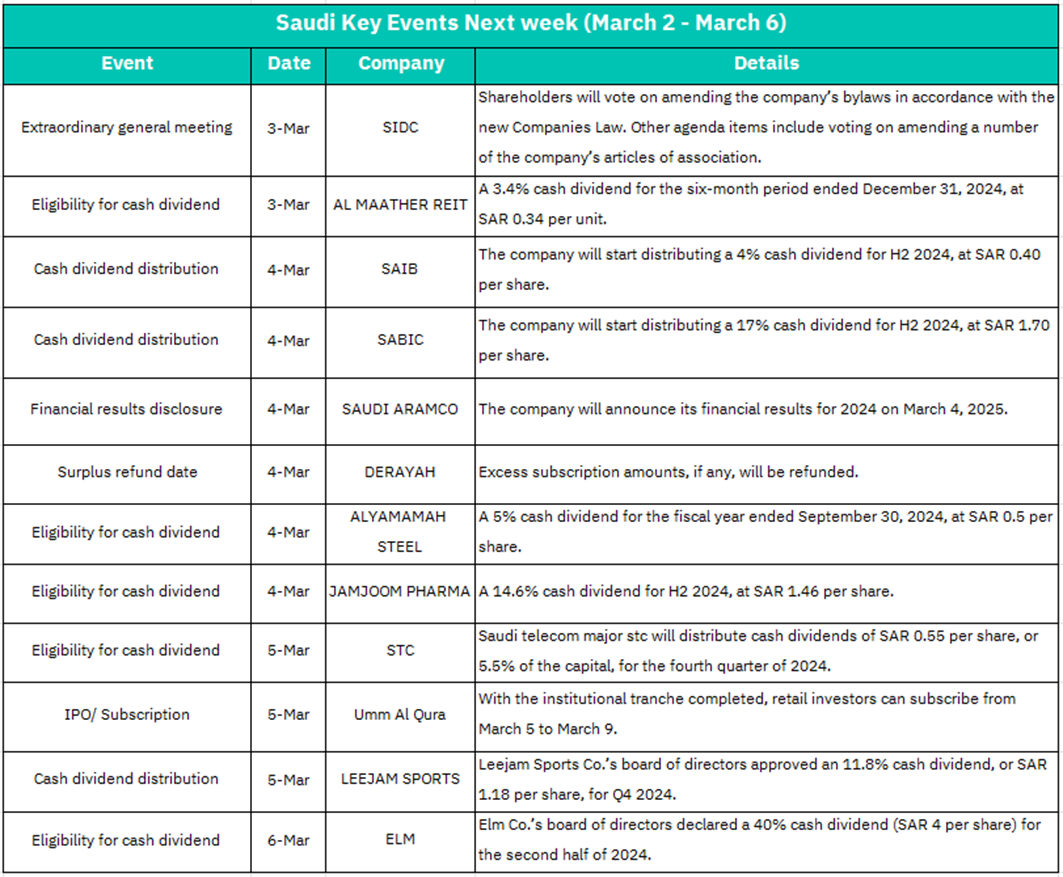
1. March 3: SIDC Special General Meeting,Shareholders voted to amend the company's articles of association and clauses to comply with the new Company Law. If the amended clauses enhance corporate governance or shareholder rights, it may boost investor confidence and potentially drive short - term share price increases.
AL MAATHER REIT Dividend Record Date,3.4% cash dividend (0.34 SAR per unit) for the 6 - month period ending December 31, 2024 was distributed. The high dividend yield (3.4%) may attract REIT investors and could push up the share price in the short term. But it's necessary to pay attention to whether the income from the underlying assets is sustainable.
2. March 4:SAIB & SABIC Dividend Payout, SAIB: A 4% dividend (0.40 SAR per share) was distributed, demonstrating stable cash flow, which may attract dividend - seeking investors and provide short - term support for the stock price. SABIC: A high dividend of 17% (1.70 SAR per share) was distributed, exceeding the market's average dividend yield. This is positive for the stock price, but there is a need to be cautious about whether future earnings can sustain such high dividend payouts.
Aramco's 2024 Financial Report Disclosure, the world's largest oil company announced its financial results, which are expected to focus on oil price fluctuations, production levels, and its new energy strategy. If earnings exceed expectations or a new dividend plan is announced, it will boost the energy sector and the Saudi stock market.
ALYAMAMAH STEEL & JAMJOOM PHARMA dividend record date, ALYAMAMAH STEEL declared a 5% dividend (0.50 SAR per share), reflecting an industry recovery, which may attract investors interested in cyclical stocks. JAMJOOM PHARMA, a high dividend of 14.6% (1.46 SAR per share) was declared, which is exceptionally impressive. However, there is a need to be cautious about whether the high dividend payout is due to one - time gains or a reduction in business operations.
DERAYAH subscription refund, refund of excess funds from the IPO.
3. March 5: STC Dividend Record Date, A 5.5% dividend (0.55 SAR per share) was declared. As a telecommunications leader, stable dividends may solidify its status as a "defensive stock," supporting the stock price. However, attention should be paid to the pressure on cash flow due to 5G investments.
Umm Al Qura IPO Retail Subscription, institutional subscription has been completed, and retail investors can subscribe from March 5th to 9th, if the subscription is enthusiastic, it may boost market sentiment in the short term. However, attention should be paid to the risk of the stock price falling below the issue price after listing, especially when the valuation is high.
LEEJAM SPORTS Dividend Payout, a dividend of 11.8% (1.18 SAR per share) was distributed, with a dividend yield significantly higher than that of its peers. The high payout may reflect strong performance (such as the recovery of the fitness industry), but it is necessary to confirm the sustainability of profits to avoid a "dividend trap."
4. March 6: ELM Dividend Record Date, an exceptionally high dividend of 40% (4.00 SAR per share) was declared. The unusually high dividend yield may be due to one - time gains or strategic adjustments. The stock price may surge in the short term, but there is a need to be cautious about the risk of declining profits later on.
U.S. Market
S&P500 Technical Analysis:
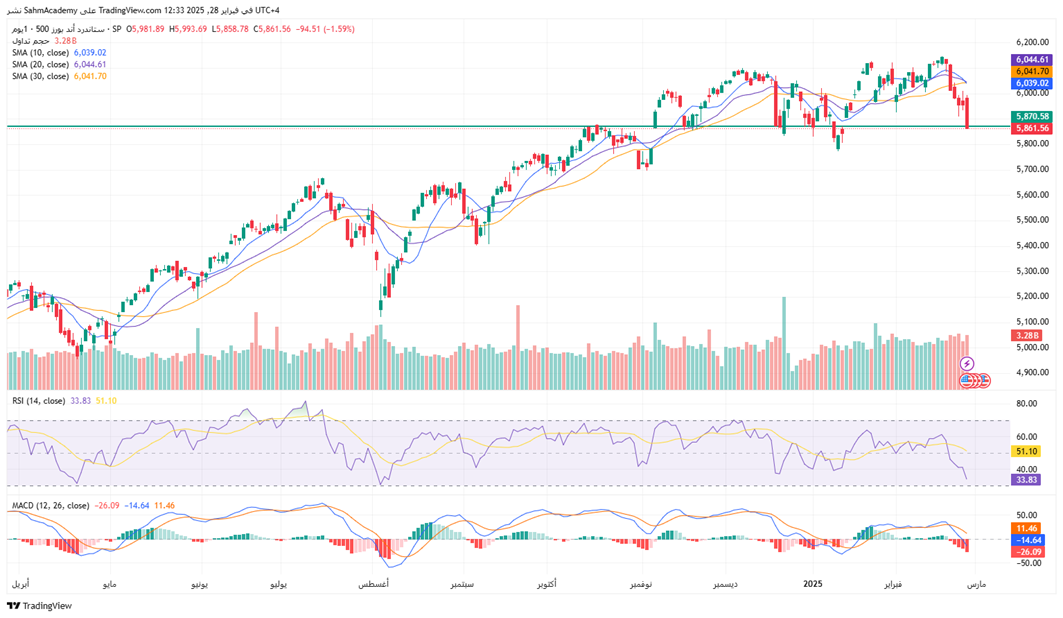
The S&P 500 index fell 2.52% last week, and the index has fallen below the important support level of 5870 points, and the price has formed a clear downward trend. After breaking the support, it usually means that the support becomes resistance, so if the price cannot regain this level, it will continue to be under pressure in the short term.
The RSI is currently at 33.83, close to the oversold zone (below 30), but still not falling into the extreme oversold zone, indicating that the market may be in the stage of selling pressure release, but has not reached the extreme of complete oversold.
The MACD is currently showing a negative value, and both the DIFF (fast line) and DEA (slow line) are diverging downwards, indicating that the short - term bearish momentum in the market remains strong. The negative MACD histogram (red) shows that the downside momentum has not yet weakened. If there is no significant technical reversal, the market still faces the risk of further decline.
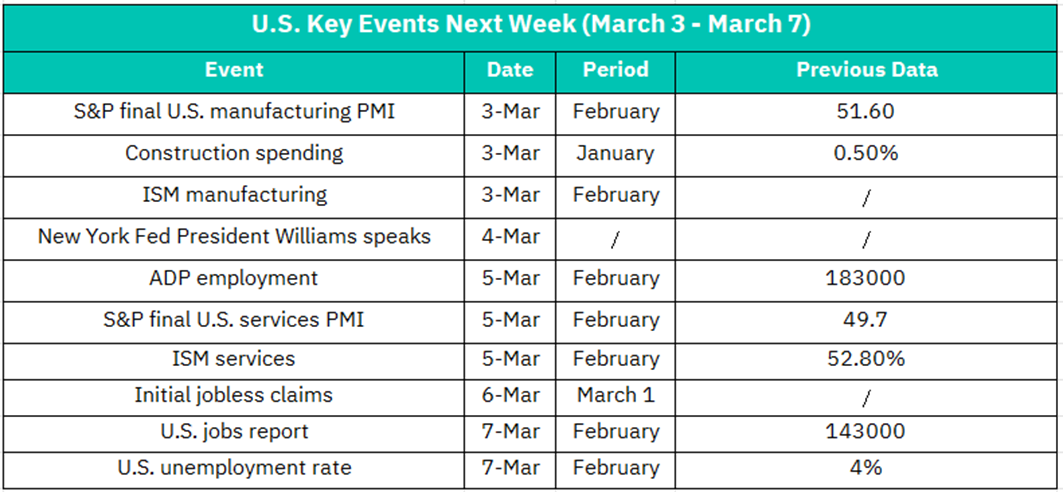
1. March 3 – S&P U.S. Manufacturing PMI Final Value (February)
Previous Value: 51.60. PMI above 50 indicates manufacturing expansion. If the final value is higher than the preliminary figure, it may boost industrial stocks and cyclical sectors. Conversely, a figure lower than expected could raise concerns about the economic momentum.
–U.S. Construction Spending (January)
Previous Value: +0.50%. data reflects the degree of real estate and infrastructure investment. If the growth exceeds expectations, it will be positive for construction and materials.
–ISM Manufacturing Index (February)
The ISM is a more authoritative manufacturing indicator. If the index rises above 50, it may strengthen the U.S. dollar and boost manufacturing stocks. On the contrary, if it continues to contract, it may drag down the overall market.
2. March 4 – Speech by New York Fed Chair Williams
Attention should be paid to his remarks on inflation, employment, and interest - rate policy. If he sends "hawkish" signals (such as hinting at interest - rate hikes), it may trigger market volatility.
3. March 5 – ADP Employment Report (February)
Previous Value: 183,000. It serves as a leading indicator of non - farm payrolls. If the data is strong (e.g., exceeding 200,000), it may suggest a positive outlook for non - farm payrolls, which is positive for consumer and financial stocks. However, a figure lower than expected may raise concerns about economic slowdown.
– S&P U.S. Services PMI Final Value (February)
Previous Value: 49.7. The service sector accounts for over 70% of the U.S. economy. If the final value breaks through 50 and enters the expansionary range, it may drive up the technology and consumer services sectors. On the contrary, it may suppress market sentiment.
– ISM Services Index (February)
Previous Value: 52.8%. If the index remains above 53, it indicates steady growth in the service sector, which is positive for the overall market. However, an unexpected decline may raise questions about the economic resilience.
4. March 6 – Initial Jobless Claims
It serves as a real - time indicator of the health of the labor market. If the number of claims continues to be below 200,000, it indicates a robust employment market, which supports risk assets. However, if the number rebounds more than expected, it could intensify concerns about an economic downturn.
5. March 7 – U.S. Nonfarm Payrolls Report (February)
Previous Value: +143,000. A market - focal point! If the increase in employment exceeds expectations (e.g., over 200,000), it may reinforce the Federal Reserve's expectation of "delaying interest - rate cuts," which is positive for the U.S. dollar but may suppress growth stocks. Conversely, if the data is weak, it may boost expectations of interest - rate cuts, driving a rebound in tech stocks.
– U.S. Unemployment Rate (February)
If the unemployment rate remains low (between 3.9% and 4.1%), it indicates economic resilience. However, an unexpected increase may raise concerns in the market about consumption and corporate earnings.
Crypto ETF Technical Analysis:
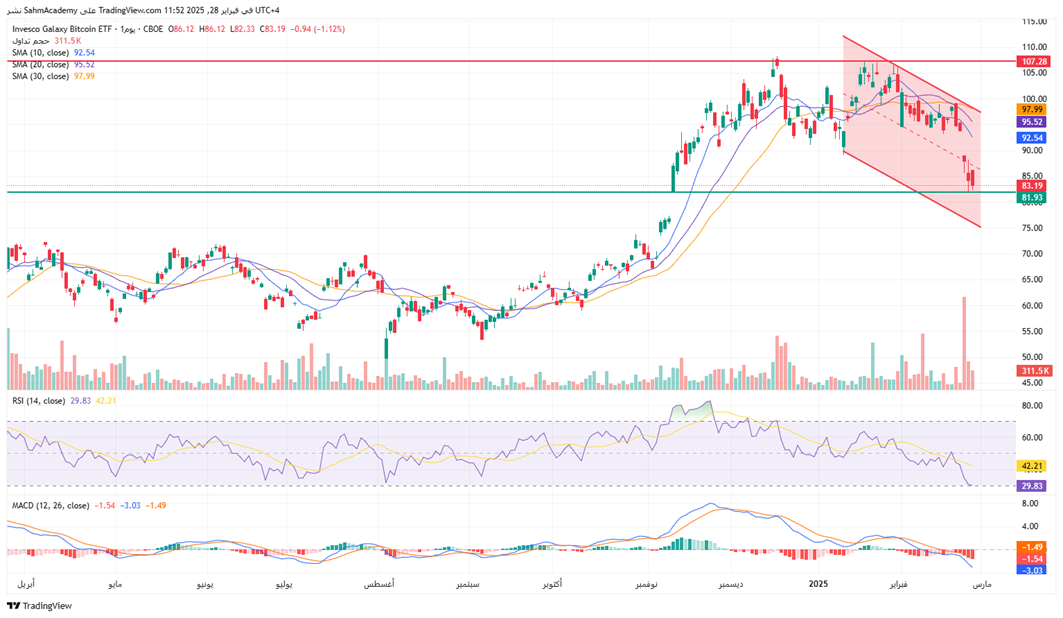
The price has recently encountered a strong bearish trend within a descending channel, shown by the red-shaded area. This suggests that the price is in a retracement phase after a significant rally. The current price is nearing the lower boundary of the channel around $81.93, which might act as a support level.
The 10-period SMA (blue line) is above both the 20-period SMA (orange line) and the 30-period SMA (yellow line), indicating a bearish crossover, confirming that the short-term trend is weaker than the medium-term one. The price is trading below the 10-period and 20-period SMAs, which suggests a bearish short-term outlook.
The RSI (14) is currently at 29.83, which is in the oversold region (below 30). This suggests that the asset might be oversold and could be due for a short-term reversal or consolidation. However, it’s important to note that oversold conditions do not guarantee an immediate reversal and may continue until the market shows signs of exhaustion.
Bitcoin has dropped below 79,000 USDT and is now trading at 78,988.78125 USDT, with a narrowed 8.69% decrease in February 28.
Cryptocurrencies were also pressured by a shift in investor risk appetite, with investors pulling back on the so-called “Trump trade” in several markets. Poor U.S. consumer confidence data raised questions about the economic outlook.
Disclaimer:
Sahm is subject to the supervision and control of the CMA, pursuant to its license no. 22251-25 issued by CMA.
The Information presented above is for information purposes only, which shall not be intended as and does not constitute an offer to sell or solicitation for an offer to buy any securities or financial instrument or any advice or recommendation with respect to such securities or other financial instruments or investments. When making a decision about your investments, you should seek the advice of a professional financial adviser and carefully consider whether such investments are suitable for you in light of your own experience, financial position and investment objectives. The firm and its analysts do not have any material interests or conflicts of interest in any companies mentioned in this report.
Performance data provided is accurate and sourced from reliable platforms, including Argaam, TradingView, MarketWatch.
IN NO EVENT SHALL SAHM CAPITAL FINANCIAL COMPANY BE LIABLE FOR ANY DAMAGES, LOSSES OR LIABILITIES INCLUDING WITHOUT LIMITATION, DIRECT OR INDIRECT, SPECIAL, INCIDENTAL, CONSEQUENTIAL DAMAGES, LOSSES OR LIABILITIES, IN CONNECTION WITH YOUR RELIANCE ON OR USE OR INABILITY TO USE THE INFORMATION PRESENTED ABOVE, EVEN IF YOU ADVISE US OF THE POSSIBILITY OF SUCH DAMAGES, LOSSES OR EXPENSES.
