
What is a moving average (MA)?
Moving average (MA) is a technical indicator for investors to use to determine the direction of a price trend. It is often one of the first indicators that traders will add to their charts and will serve as a measure on its own or in comparison with other indicators. A moving average sums up the data points of an asset over a specific time period and divides the total by the number of data points to arrive at an average. Investors use the moving average to examine support and resistance by evaluating the movements of an asset’s price.
What is the simple moving average (SMA)?
A simple moving average, the most basic of moving averages, refers to an asset’s average closing price over a specified period. It can help to determine if an asset price will continue or if it will reverse a bull or bear trend. The aim of all moving averages is to establish the direction in which the price of an asset is moving based on previous prices.
Since SMA is constructed using past closing prices, it is a lag indicator. It means that it simply displays a previous trend, but it is not predictive of future prices.
Calculating the Simple Moving Average (SMA)
A simple moving average calculates the average of a selected range of prices, usually closing prices, by the number of periods in that range. The following is the formula of SMA:
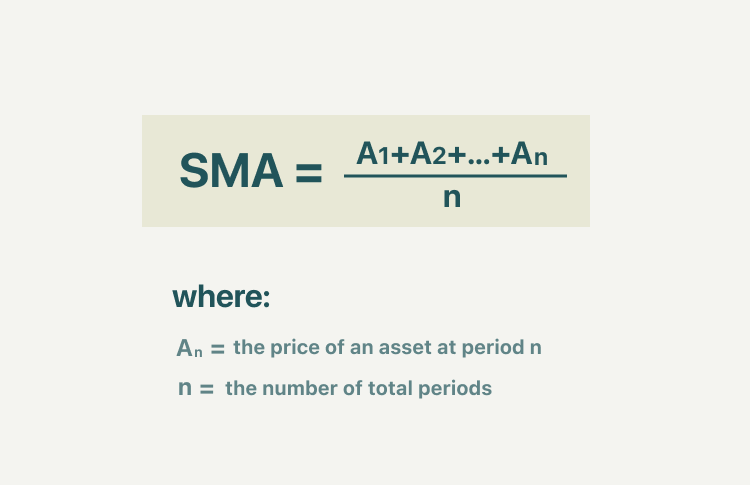
Let‘s give a quick and easy example. Suppose Company A posted the following closing stock prices:
Day | Price |
1 | $8 |
2 | $10 |
3 | $7 |
4 | $12 |
5 | $15 |
6 | $18 |
7 | $12 |
8 | $10 |
9 | $13 |
10 | $14 |
Using a 5-day SMA, we can calculate that at Day 10 (n=10), the 5-day SMA is $13.40.
SMA = (18 + 12 + 10 + 13 + 14) / 5 = 13.40
Using a 10-day SMA, we can calculate that at Day 10 (n=10), the 10-day SMA is $11.90.
SMA = (8 + 10 + 7 + 12 + 15 + 18 + 12 + 10 + 13 + 14) / 10 = 11.90
Compared with Day 10’s closing price of $14, the 5-day SMA of $13.40 was a lot closer than the 10-day SMA of $11.90. It is once again because the 5-day SMA is a shorter period, which follows the price more closely, whereas the 10-day SMA considers more historical data.
Additionally, a 10-day moving average would average out the closing prices for the first 10 days as the first data point. The next data point would drop the earliest price, add the price on day 11, then take the average, and so on. Likewise, a 50-day moving average would accumulate enough data to average 50 consecutive days of data on a rolling basis.
How does MA work?
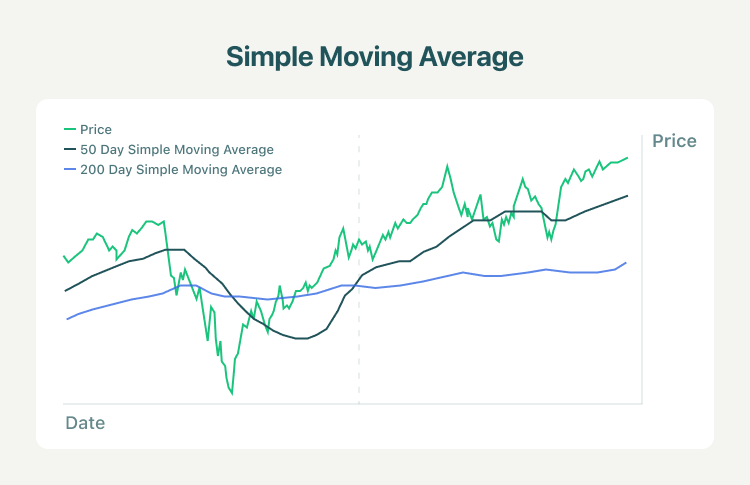
- SMAs are often used to determine trend direction. If the SMA is moving up, the trend is up. If the SMA is moving down, the trend is down. A SMA200 (200-day SMA) is a common proxy for the long-term trend. SMA50 (50-day MA) is typically used to gauge the intermediate trend. Shorter period SMAs can be used to determine shorter term trends.
- SMAs are commonly used to smooth price data and technical indicators. The longer the period of the SMA, the smoother the result, but the more lag that is introduced between the SMA and the source.
- Price crossing SMA is often used to trigger trading signals. When prices cross above the SMA, you might want to go long or cover short; when they cross below the SMA, you might want to go short or exit long.
- SMA crossing is another common trading signal. When a short period SMA crosses above a long period SMA, you may want to go long. You may want to go short when the short-term SMA crosses back below the long-term SMA.
Trading Strategies Using Simple Moving Average
1. Buying and selling on SMA intersections
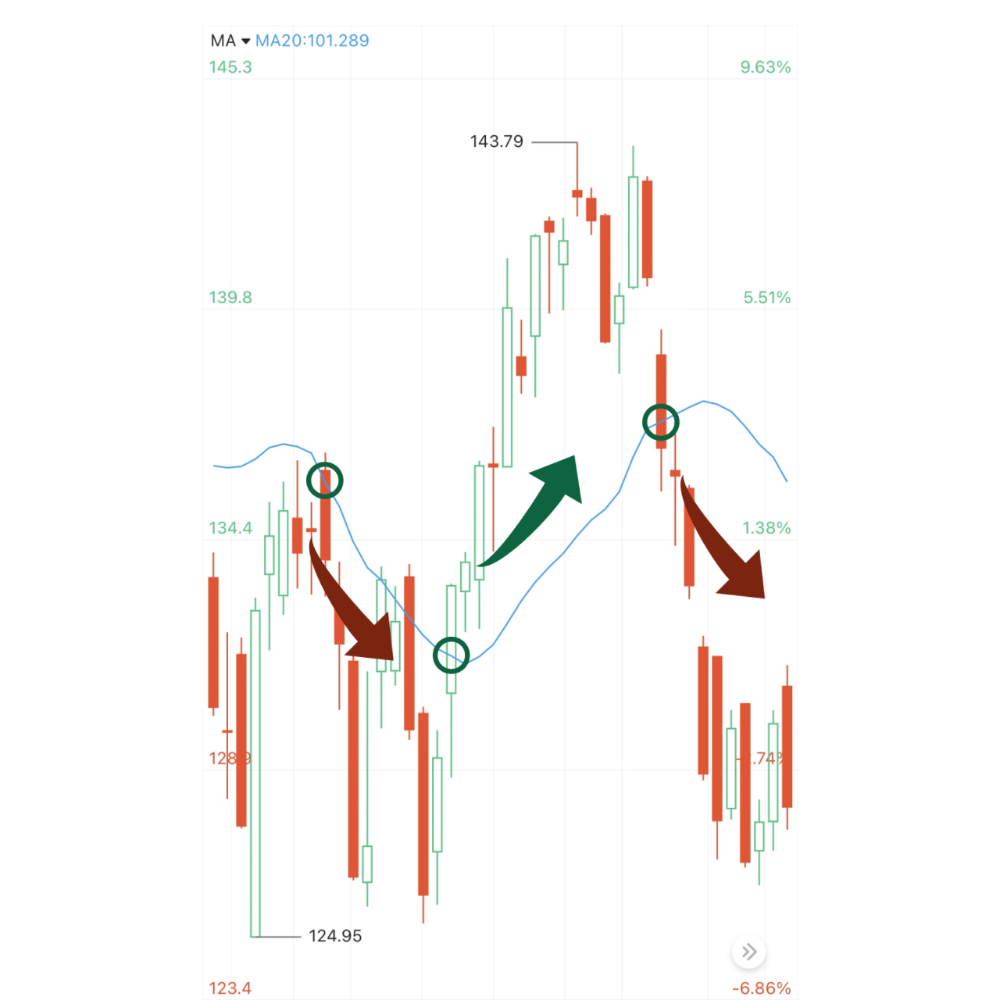
Technical traders often use SMAs to time their buy and sell trades. They usually look at when the asset price line intersects the SMA line. Let’s look at the Google example again with the SMA10.
Looking at the graph above, we can see that when the price surpasses the SMA line, the prices often trend upward for some time. It is often used as a buy indicator for technical traders. Yet when the price intersects and falls below the SMA line, we see a downtrend in prices for a bit as well. It may sometimes be a good indicator to sell. However, investors must be careful when trying to time the intersections, as the SMA is based on historical information and lags behind real-time data.
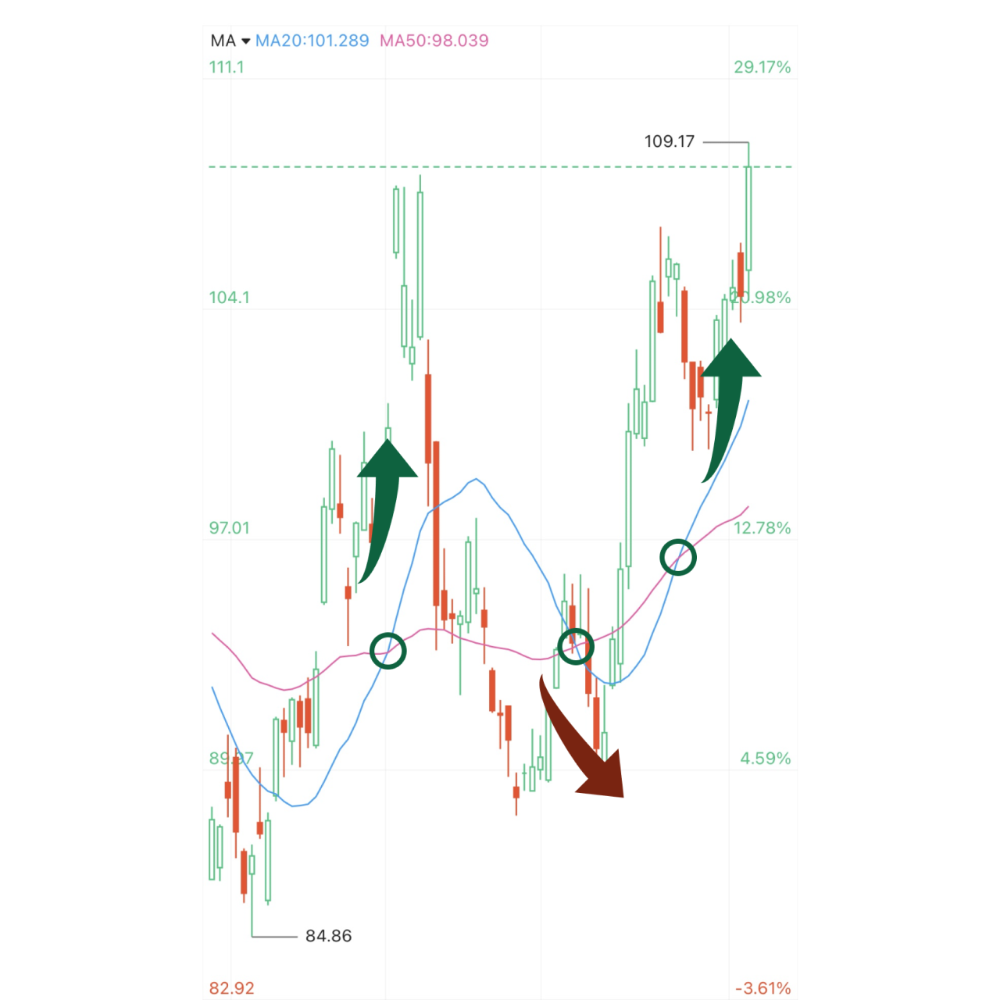
2. SMA crossover strategy
SMA crossover strategy is another technical strategy used for entering and closing trades. The strategy is done by plotting two SMA lines based on two different time frames. Looking at when the lines cross over, it helps certain traders time their trades. The most popular moving averages for longer-term investors are the SMA 50 and SMA200. For shorter-term investors, the SMA10 and SMA20 are often used as well.
Above, we are looking at Google again with 10-day (orange) and 20-day (blue) MA lines. When the 10-day line first crossed above the 20-day line, an investor who bought the stock would ideally capitalize on a two-month upwards trend. If the investor sold it right when the 10-day line crossed under the 20-day line, they would’ve exited their position before a couple of months of an overall downtrend.
Summary:
- Moving average (MA) is a technical indicator for investors to use to determine the direction of a price trend. It sums up the data points of an asset over a specific time period and divides the total by the number of data points to arrive at an average.
- A simple moving average (SMA), the most basic of moving averages, refers to an asset’s average closing price over a specified period. It can aid in determining if an asset price will continue its rise or fall or if it will reverse a bull or bear trend.
- A simple moving average calculates the average of a selected range of prices, usually closing prices, by the number of periods in that range.
- SMAs are often used to determine trend direction. If the SMA is moving up, the trend is up. If the SMA is moving down, the trend is down.
- When prices cross above the SMA line, you might want to go long or cover short; when they cross below the SMA line, you might want to go short or exit long.
- SMA crossing is another common trading signal. When a short period SMA line crosses above a long period SMA line, you may want to go long. You may want to go short when the short-term SMA line crosses back below the long-term SMA line.
