What is Zig Zag indicator?
The Zig Zag Indicator is a technical analysis tool designed to identify changes in market trends. It helps traders pinpoint significant trends, filter out minor price fluctuations, and spot potential trend reversals in the stock market.
How to set Zig Zag parameters?
To effectively use Zig Zag indicator, you need to set two key parameters: deviation and depth. Here’s how to set them:
1. Deviation: This parameter specifies the minimum percentage price change needed to draw a new line. For instance, a deviation of 5% means the indicator will only plot a new line if the price changes by at least 5% from the previous swing point.
- High volatility markets: When markets are highly volatile, you may want to increase the deviation to filter out smaller, less significant price movements.
- Low volatility markets: In more stable markets, a lower deviation setting can help you capture smaller trends.
2. Depth: This parameter sets the minimum number of candlesticks required between two swing highs or lows.
- Short-term analysis: If you are looking for shorter-term trends, you might set a smaller depth value (e.g., 5-10 bars).
- Long-term analysis: For capturing longer-term trends, a larger depth value (e.g., 20-50 bars) is more appropriate.
How to use Zig Zag indicator tracing trends & reversals?
1. Identify Trend Changes
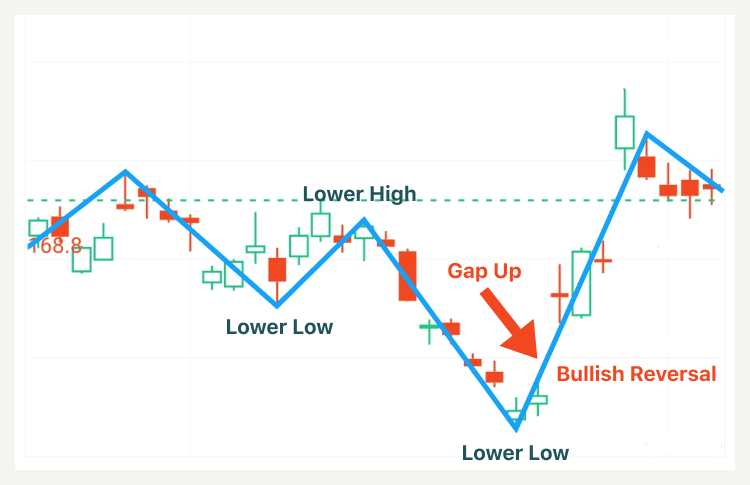
- Bullish reversal
To identify a bullish reversal, the Zig Zag Indicator should show a series of lower highs and lower lows. For example, when a gap up is formed, confirming further upside follow-through, you may consider entering a long position or exiting your short position, as shown below:
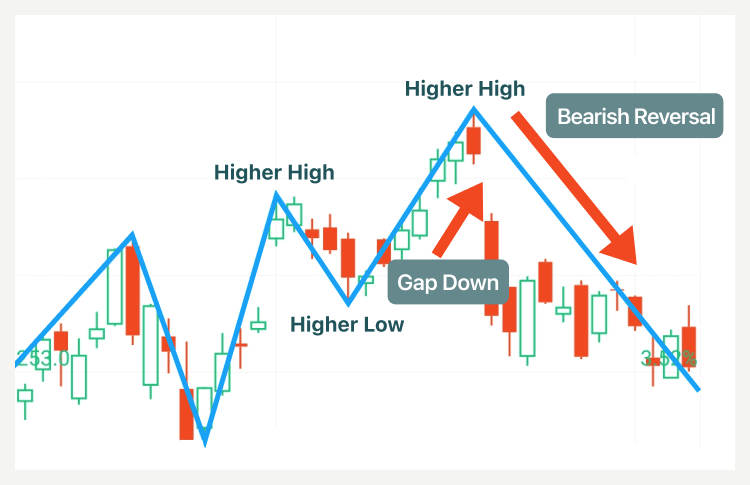
- Bearish reversal
To identify a bearish reversal, the Zig Zag Indicator should show a series of higher highs and higher lows. For example, when a gap down is formed, confirming further downside follow-through, you may consider entering a short position or exiting your long position, as illustrated below:
In addition, traders should use reversal signals alongside other tools like support/resistance breakouts and moving average crossovers to find entry and exit points.
2. Identify Common Chart Patterns
The Zig Zag indicator helps traders spot key patterns such as head and shoulders, double tops and bottoms, and various types of triangles and channels (ascending and descending).
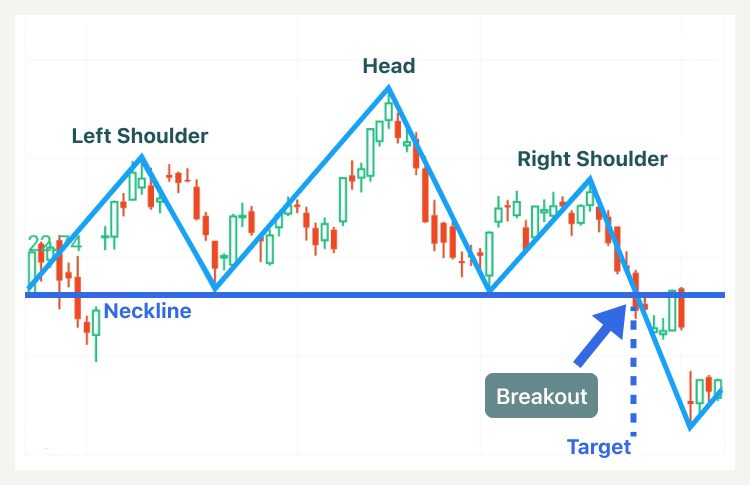
- Head and shoulders
The Zig Zag Indicator can confirm the presence of a head and shoulders pattern by connecting the swing highs. As seen below:
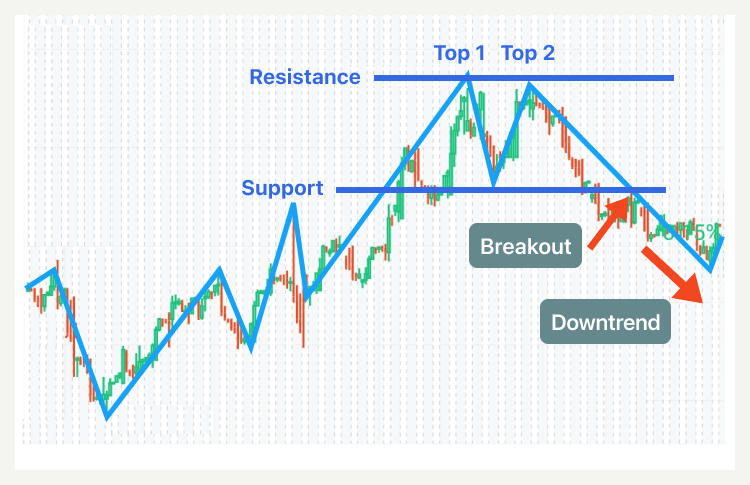
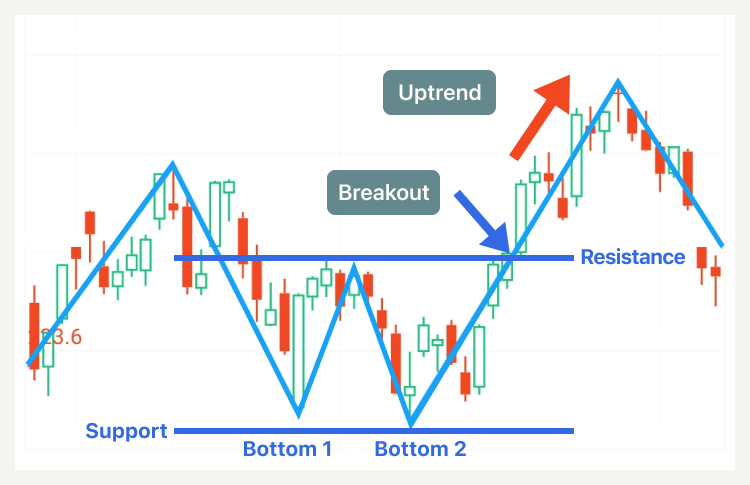
- Double Tops and Bottoms
The Zig Zag Indicator can be effectively used in conjunction with the double top and bottom chart patterns to identify potential trend reversals. As shown below:
3. Spot Elliott Waves
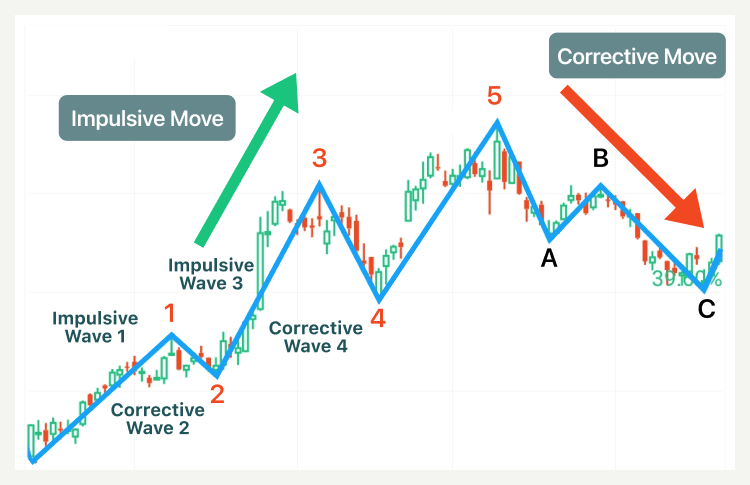
The Zig Zag Indicator simplifies Elliott Wave analysis, highlighting significant swing highs and lows that form the basis of Elliott Wave patterns. To use it effectively, set appropriate depth and deviation parameters to ensure it captures major market moves. Identify impulsive waves (1, 3, and 5) as strong directional moves connected by the Zig Zag lines, while corrective waves (A-B-C) appear as retracements. As indicated below:
4. Use Zig Zag with Other Tools
To enhance its effectiveness, use the Zig Zag indicator in conjunction with other technical analysis tools like moving averages, Fibonacci retracements and trendlines. This multi-faceted approach can provide more robust signals and confirmation of patterns.


