
What is Moving Average Convergence Divergence (MACD)?
The MACD indicator is a momentum oscillator that measures the amount that an asset's price has changed over a given period of time. It is a trend-following momentum indicator that shows the relationship between two exponential moving averages (EMAs) of an asset’s price. The MACD indicator consists of three components:
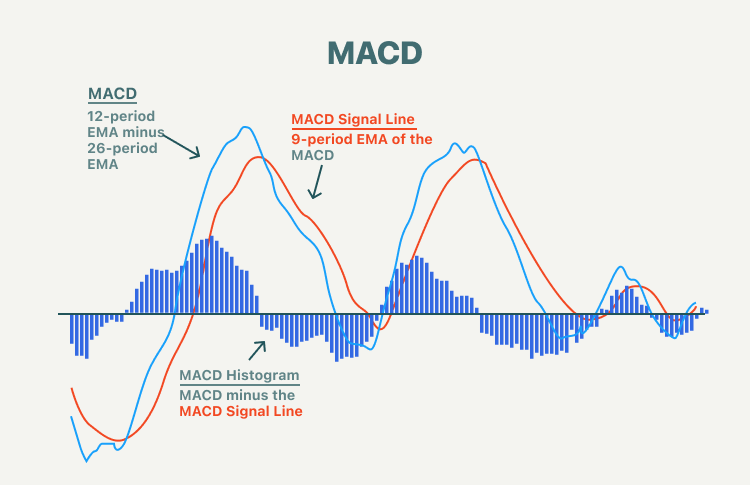
- MACD line: The MACD line is calculated by subtracting the 26-period EMA from the 12-period EMA, which is generally called DIF.
- Signal line: The signal line is a 9-day EMA of the MACD line, commonly known as DEA, which is then plotted on top of the MACD line, and function as a trigger for buy or sell signals.
- Histogram: The histogram is the graphical representation of the divergence and convergence of the MACD line and the signal line. For example, the distance between the two. When the MACD line is above the signal line, the histogram is positive; it is negative when the MACD line is below the signal line.
Calculating MACD
MACD is calculated by subtracting the long-term EMA (26 periods) from the short-term EMA (12 periods). An EMA is a type of moving average (MA) that places a greater weight and significance on the most recent data points.
- MACD line formula: MACD line = 12-day EMA – 26-day EMA
- Signal line formula: 9-day EMA of MACD line
The signal line is the 9-day EMA of the MACD line itself. Although not consistently accurate, the combined analysis of the signal line with the MACD line may help spot potential reversals or entry and exit points, especially when the MACD line is far above or far below the zero line.
- The MACD histogram formula: MACD histogram = MACD line – Signal line
The MACD histogram illustrates the difference between MACD and the signal line. It is calculated by subtracting one from the other. The histogram is made of a bar graph, making it visually easier to read and interpret.
MACD trading strategies
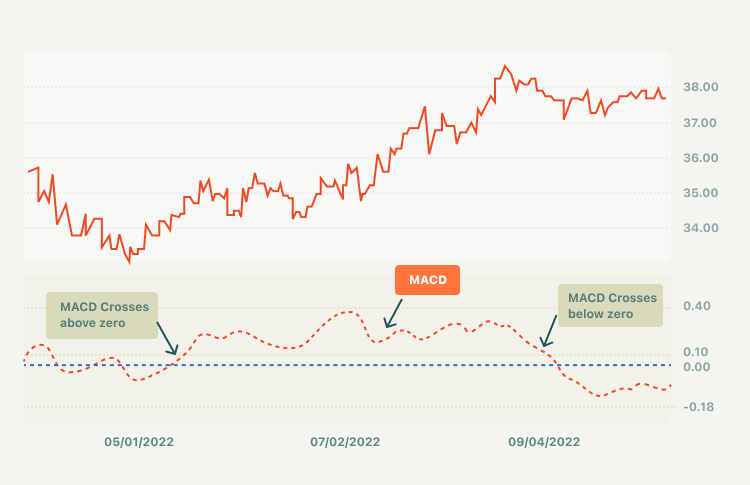
- MACD line crossing above zero is considered bullish while crossing below zero is bearish. Additionally, when MACD turns up from below zero it is considered bullish. When it turns down from above zero it is considered bearish.
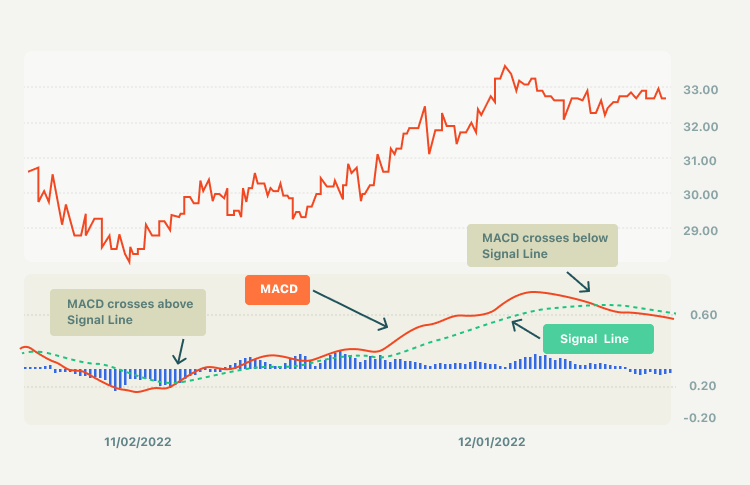
- When the MACD line crosses from below to above the signal line, the indicator is considered bullish. The further below the zero line the stronger the signal. When the MACD line crosses from above to below the signal line, the indicator is considered bearish. The further above the zero line the stronger the signal.
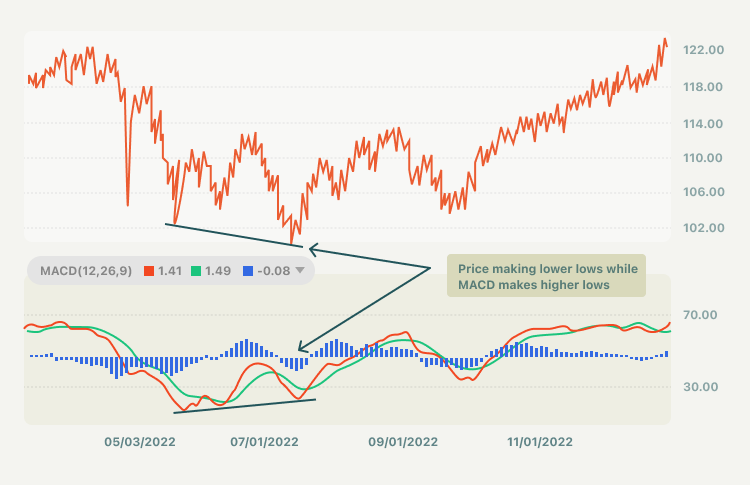
- Divergence between the MACD and the price action is a stronger signal when it confirms the crossover signals.
Summary:
- MACD is a trend-following momentum indicator that shows the relationship between two exponential moving averages (EMAs) of an asset’s price.
- MACD can alert investors of bullish/bearish divergences (e.g., when a new high in price is not confirmed by a new high in MACD, and vice versa), suggesting a potential failure and reversal.
- The MACD indicator consists of three components: MACD line, signal line, and histogram. The MACD line is calculated by subtracting the 26-period EMA from the 12-period EMA, which is generally called DIF.
- MACD line crossing above zero is considered bullish while crossing below zero is bearish.
- When the MACD line crosses from below to above the signal line, the indicator is considered bullish. When the MACD line crosses from above to below the signal line, the indicator is considered bearish. The further above the zero line the stronger the signal.
- The divergence between the MACD and the price action is a stronger signal when it confirms the crossover signals.
