Meta Platforms Inc.
AI Ambitions Drive Growth Despite Near-term Profit Pressure
Date: November 13, 2024
Financial Insights:
Meta's Q3 overall performance and guidance exceeded market expectations. However, active user growth fell short of expectations, while AI business losses and investments were excessive. Wall Street appears to be losing patience with the AI business's inability to turn a profit. Meta's stock price dropped approximately 4% following the earnings release.
1. Meta reported Q3 revenue of approximately $40.6 billion, up 19% year-over-year, slightly above market expectations. Net profit for Q3 reached $15.7 billion, a 35% increase year-over-year, significantly exceeding market expectations.
2. Daily active users in September reached 3.29 billion, up 5% year-over-year, slightly below market expectations.
3. Reality Labs (Metaverse & AI) division: Revenue grew 29% year-over-year to $270 million, below analysts' expectations of $310 million; operating loss was $4.4 billion.
4. The company's CFO indicated that Reality Labs' operating losses will increase significantly in 2024 due to product development and large-scale investments. Meanwhile, the company's CEO stated that capital expenditure will increase significantly in 2025.
Key Points:
1. The growing adoption and ad monetization of Reels continues to enhance Meta's discovery engine and content recommendation models, showcasing a successful return on investment in natural language models. With ongoing investments in generative AI and the deployment of breakthrough applications, Meta is poised to strengthen its competitive edge further.
2. Meta's AI glasses already offer basic interactions, with the ultimate goal being to launch glasses with sufficient computing power to replace smartphones. This will drive revolutionary changes in end-user hardware. However, to achieve this goal, Meta must continue to increase its AI investments, including purchasing more GPU chips for model training, which will put some pressure on short-term profits.
3. We don't expect the current pressure on profits to mirror the 2022 downturn. Meta's Q3 advertising performance was robust, and unlike 2022, the company's strong advertising monetization is now effectively counterbalancing its heavy investments. This represents a fundamental difference from the challenges faced in 2022.
4. The main short-term issue facing Meta is overly optimistic market expectations, demonstrated by the stock's decline despite strong earnings beat. The advertising business is unlikely to sustain 20% growth long-term, with factors such as lower-than-expected ad spending from Temu and Shein, while ongoing price hikes may push advertisers toward more cost-effective emerging platforms. Revenue growth is expected to slow to approximately 15% next year.
5. Meta currently trades at a PE multiple of 26x, slightly above its historical average. Based on our projected 15% growth for 2025, this translates to a PEG ratio of approximately 1.5x, which can be considered reasonable overall. However, the market is conflicted - inflated short-term expectations and concerns about high capital expenditure impacting profits are causing increased stock volatility. Yet Meta's core competitive advantages in AI provide strong support at lower levels. We assess that Meta's short-term price movement will likely remain range-bound, with both upside resistance and downside support.
6. From a long-term perspective, we are highly optimistic about Meta. The company is building core competitive moats in AI, while Reels still has significant room for price increases. Threads has already surpassed 200 million monthly active users, and Meta may introduce advertising on the platform in the future. With user growth, new product launches, improved targeted advertising capabilities, and price increases, Meta's revenue growth outlook remains very strong.
Technical Analysis:
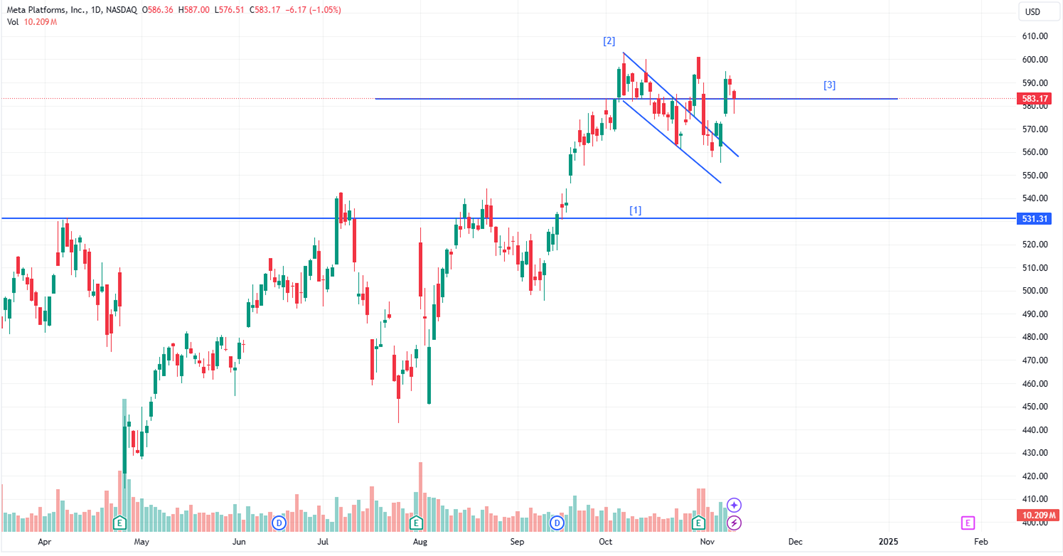
Looking at this year's trend, $531 has been a significant resistance level, briefly reached in April, July, and August without holding. September's smooth rally finally broke through this resistance, and while there was a pullback after reaching new highs of $600 [2], it notably didn't retreat to $531. Strong buying pressure at $583 [3] suggests this is merely a continuation pattern within the uptrend.
The former $531 resistance has now become a solid support level [1]. Currently, the stock is consolidating in a narrow range at higher levels. With $583 as a reference point, technical patterns suggest potential movement toward the $640 level.

[1] Resistance turned Support: Indicates that a price level has transformed from a previous resistance level into a new support level.
[2] Continuation Pattern in an Uptrend: This refers to a minor pullback during an upward trend, caused by profit-taking and share redistribution. These small declines don't break the overall upward momentum but rather represent a healthy consolidation phase where shares transfer between investors.
[3] Key Oscillation Level: A price point where the stock repeatedly fluctuates back and forth in the short term, and can be considered a short-term support level.
Research Report Appendix
Company Concept:
Meta (formerly Facebook) is a tech giant that dominates social media through its family of apps including Facebook, Instagram, and WhatsApp, while heavily investing in virtual reality and artificial intelligence to build what it calls the "metaverse" - its vision for the future of digital interaction.


Model Explanation:
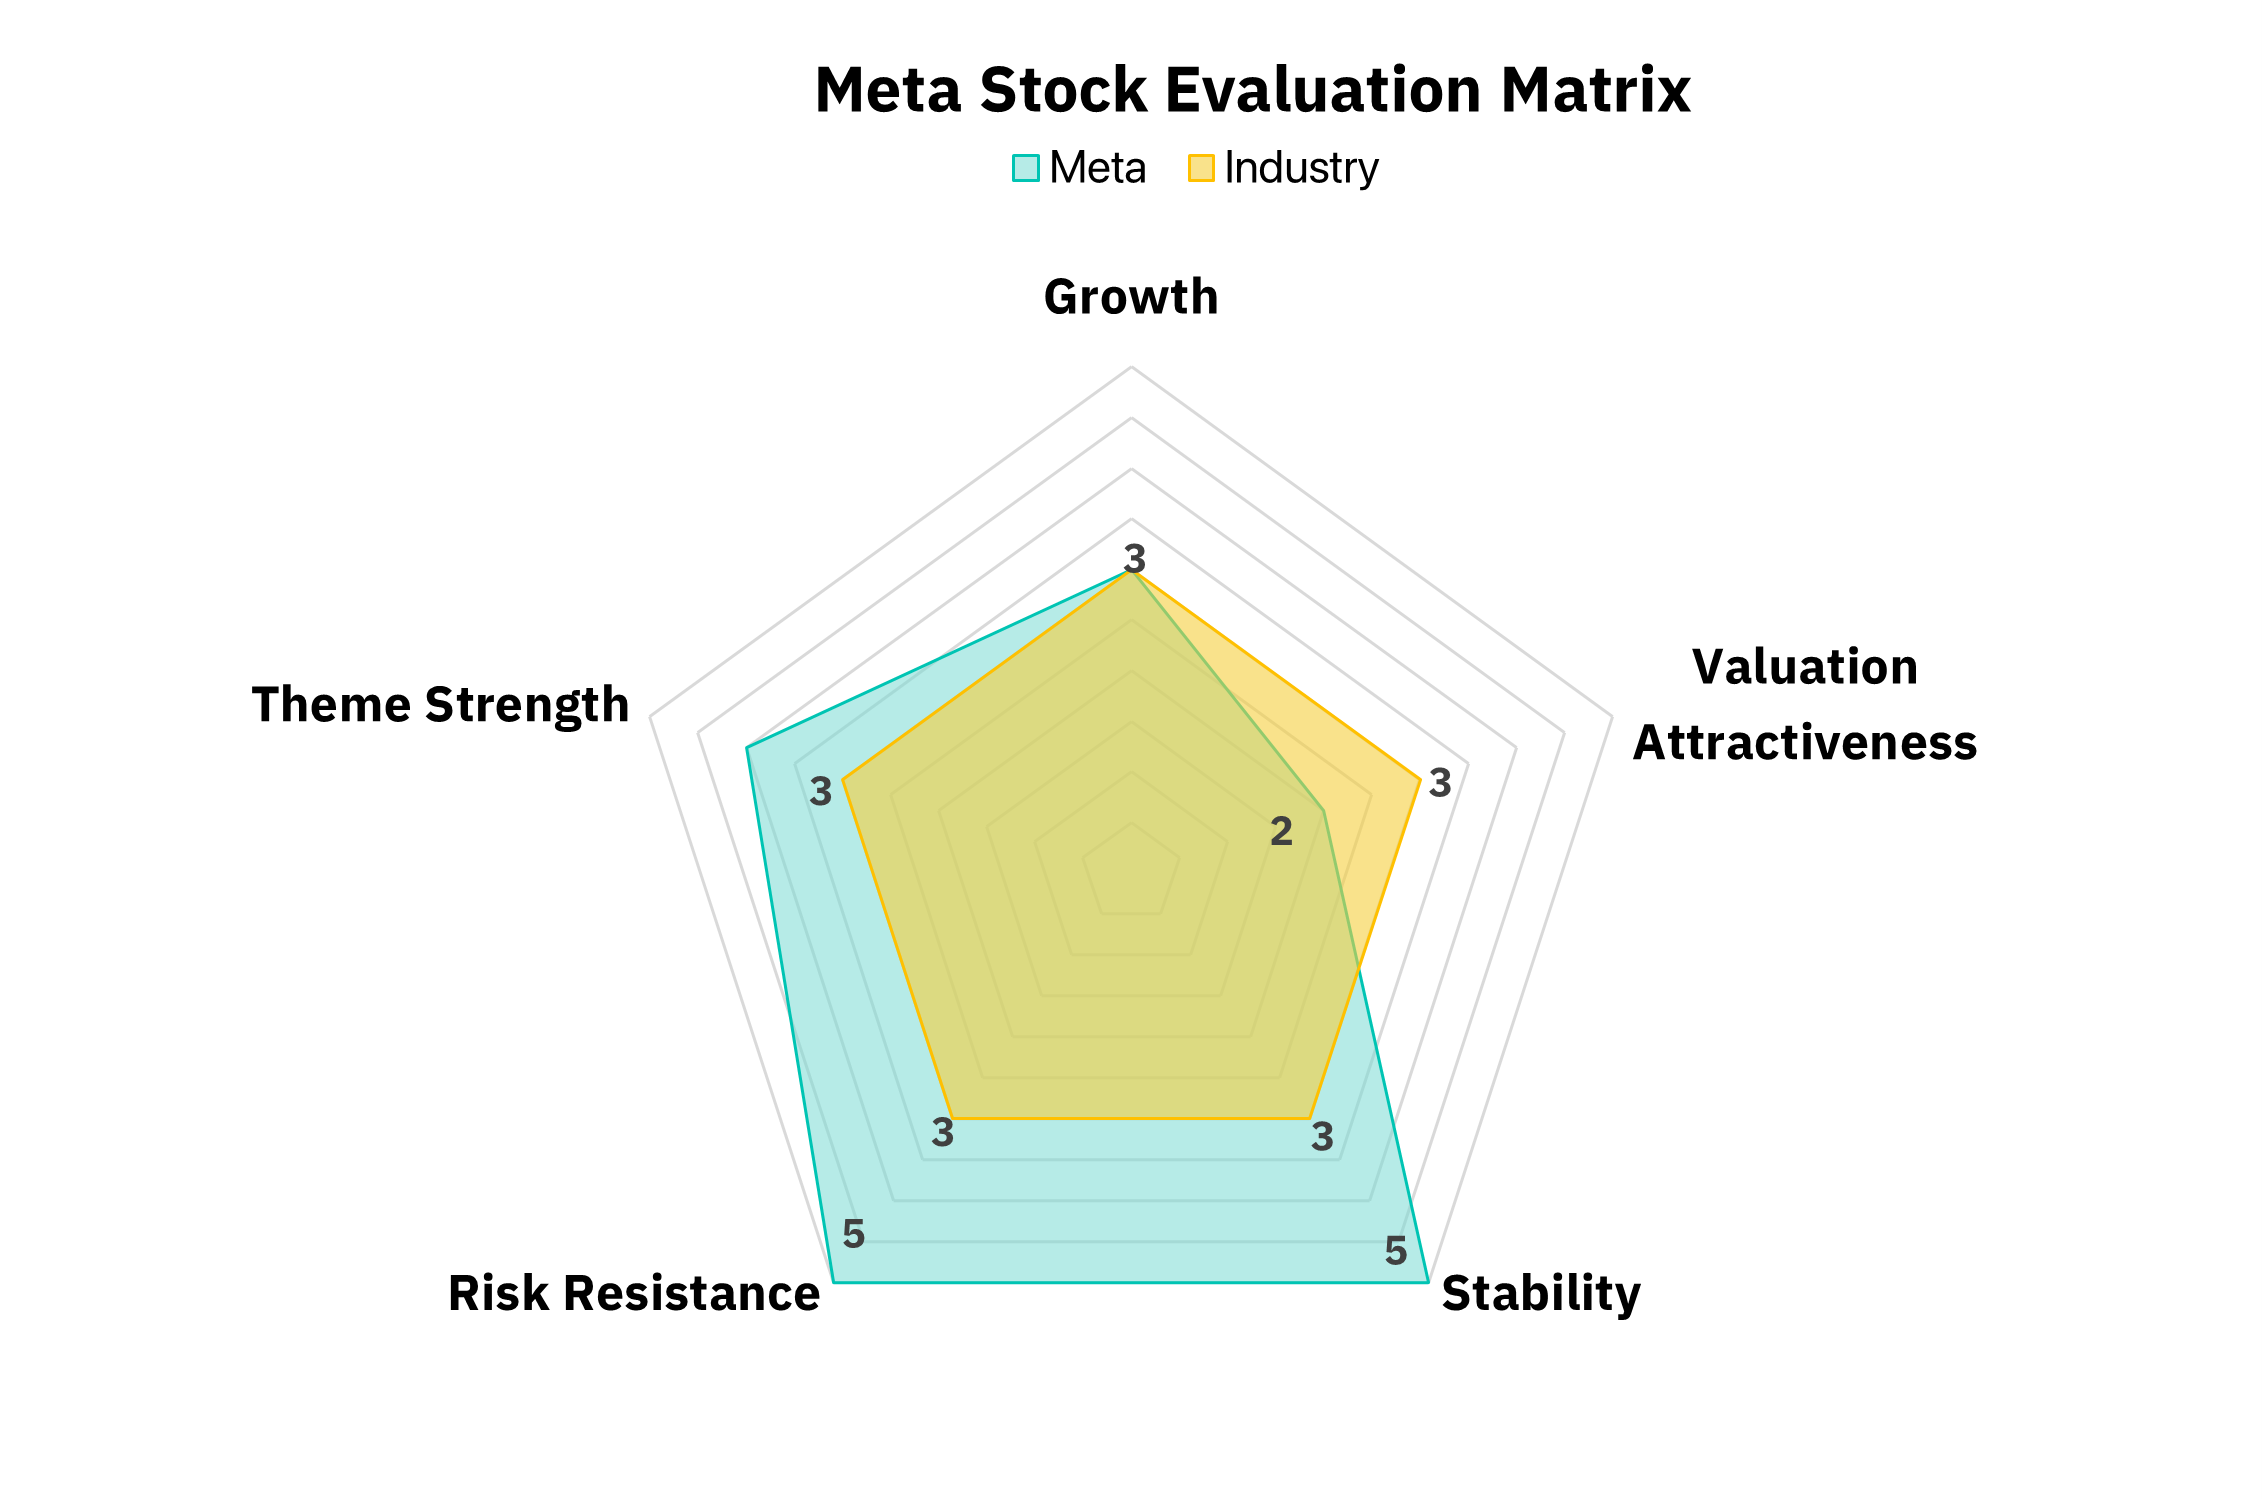
The model primarily evaluates companies and industries across five dimensions: growth ability, valuation attractiveness, stability, risk resistance ability, and theme strength. Each dimension is scored from 1-5, with 1 being the lowest and 5 the highest. Overall, higher scores indicate stronger fundamentals. For each dimension, a multi-factor model will be constructed based on industry and historical data of selected stocks, and a quantitative model will be used to automatically score each dimension.
Here are the dimensions explained:
- Growth Ability: Measures future performance potential; higher growth rates yield higher scores.
- Valuation Attractiveness: Assesses stock valuation; lower valuations earn higher scores.
- Stability: Evaluates the consistency of profit generation; greater stability means higher scores.
- Risk Resistance: Gauges the capacity to endure macroeconomic changes; better risk resistance leads to higher scores.
- Theme Strength: Rates market favor for the stock in the short term; increased favor results in higher scores.
Disclaimer:
The Information presented above is for information purposes only, which shall not be intended as and does not constitute an offer to sell or solicitation for an offer to buy any securities or financial instrument or any advice or recommendation with respect to such securities or other financial instruments or investments. When making a decision about your investments, you should seek the advice of a professional financial adviser and carefully consider whether such investments are suitable for you in light of your own experience, financial position and investment objectives. The firm and its analysts do not have any material interest or conflict of interest in Meta Platform Inc.
IN NO EVENT SHALL SAHM CAPITAL FINANCIAL COMPANY BE LIABLE FOR ANY DAMAGES, LOSSES OR LIABILITIES INCLUDING WITHOUT LIMITATION, DIRECT OR INDIRECT, SPECIAL, INCIDENTAL, CONSEQUENTIAL DAMAGES, LOSSES OR LIABILITIES, IN CONNECTION WITH YOUR RELIANCE ON OR USE OR INABILITY TO USE THE INFORMATION PRESENTED ABOVE, EVEN IF YOU ADVISE US OF THE POSSIBILITY OF SUCH DAMAGES, LOSSES OR EXPENSES.


