
What is a flag?
A flag is a short-term price pattern used to identify the possible continuation of a previous trend from a point at which price has drifted against that same trend. It is named because of the way it reminds the viewer of a flag on a flagpole, and the pattern usually follows a sharp advance or decline with heavy volume, and it marks a midpoint of the move.
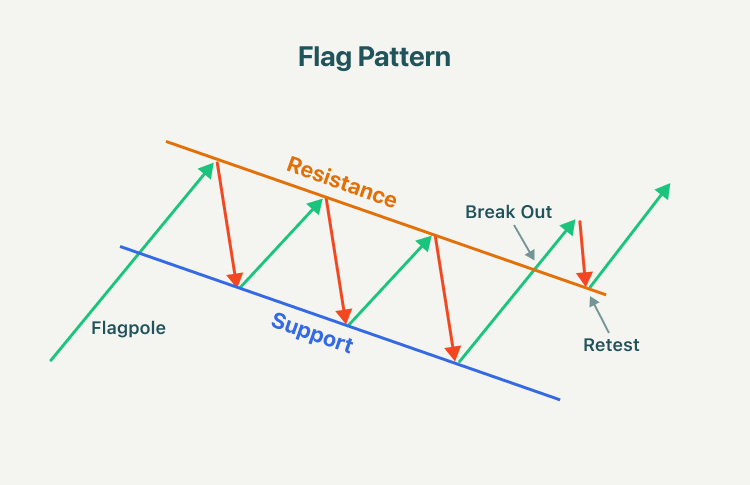
Flags are areas of tight consolidation in price action showing a counter-trend move that follows directly after a sharp directional movement in price. The patterns can be either upward trending (bullish flag) or downward trending (bearish flag). The bottom of the flag should not exceed the midpoint of the flagpole that preceded it.
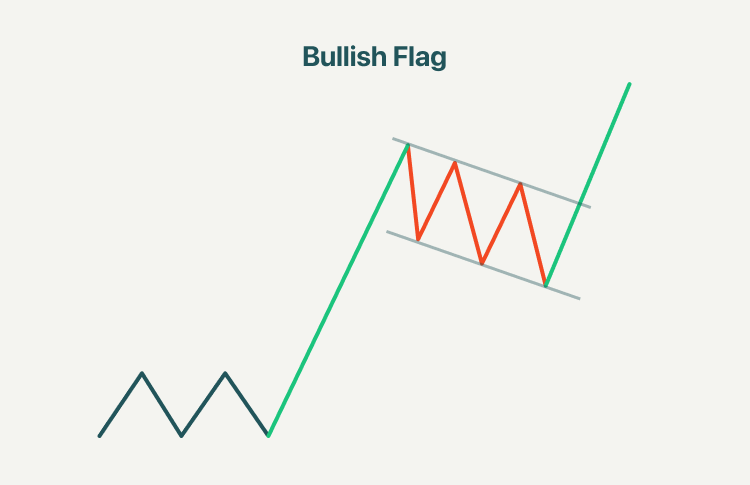
What is a bullish flag pattern?
A bullish flag is a continuation pattern that occurs as a brief pause in the trend following a strong price move higher. This pattern looks like a downward sloping channel denoted by two parallel trend lines against the preceding trend.
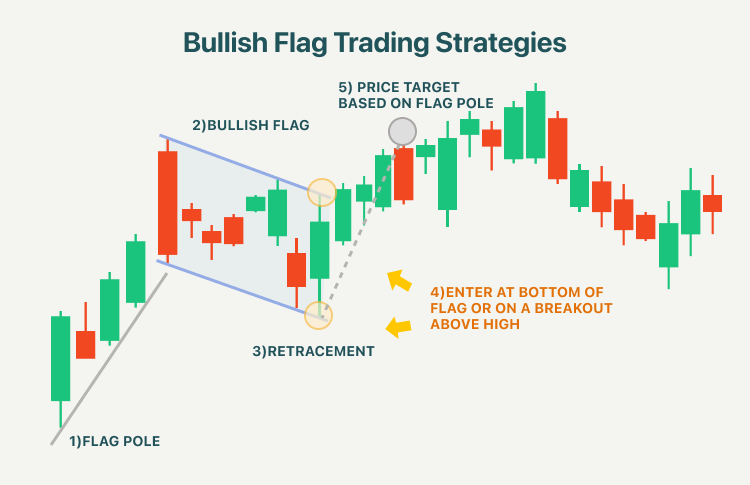
During this period of consolidation, dwindling trading volume through its formation and resolve to push higher on the breakout. When identify the bull flag pattern, there are five important components traders should look at:
- Preceding uptrend (flag pole)
- Identify downward sloping consolidation (bull flag)
- If the retracement becomes deeper than 50%, it may not be a flag pattern
- Enter at bottom of the flag or on the breakout above the cap of the upper channel boundary
- Look for price to break higher with a length potentially equal to the size of the flagpole
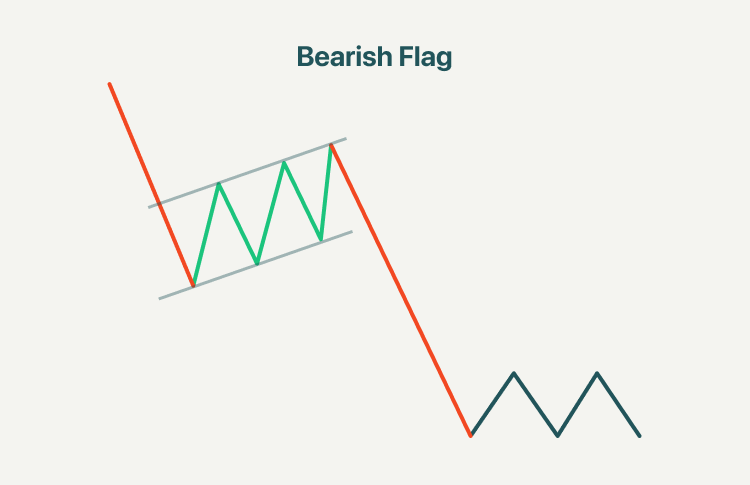
What is a bearish flag pattern?
The bearish flag signals the extension of the downtrend once the temporary pause is finished. As a continuation pattern, the bear flag helps sellers to push the price action further lower. After a strong downtrend, the price action consolidates within the two parallel trend lines in the opposite direction of the downtrend. Once the supporting trend line gets broken, the bear flag pattern is activated as the price action continues trading lower.
To trade bearish flag patterns, there are three characteristics that traders should consider:
- Traders will need to find the flag pole which will be identified as an initial decline. This decline can be steep or slowly sloping and will establish the basis for the trend.
- The bear flag is identified as a period of consolidation after the completion of prices' initial decline. During this period, prices may slowly channel upward and retrace a portion of the initial move.
- After the price begins to move lower again, traders can then look for the price to break lower with a length potentially equal to the size of the flagpole.
How to trade flag patterns?
1. Bullish flag trading strategy
Even though flags suggest a continuation of the current trend, it is prudent to wait for the initial breakout to avoid a false signal. Traders typically expect to enter a flag after the price has broken and closed above (long position) the upper parallel trend line. For stop loss, traders expect to use the opposite side of the flag pattern as a stop-loss point, such as retracement point. Traders then measure the distance in dollar terms between the pattern’s high and the base of the flagpole to set a profit target.
2. Bearish flag trading strategy
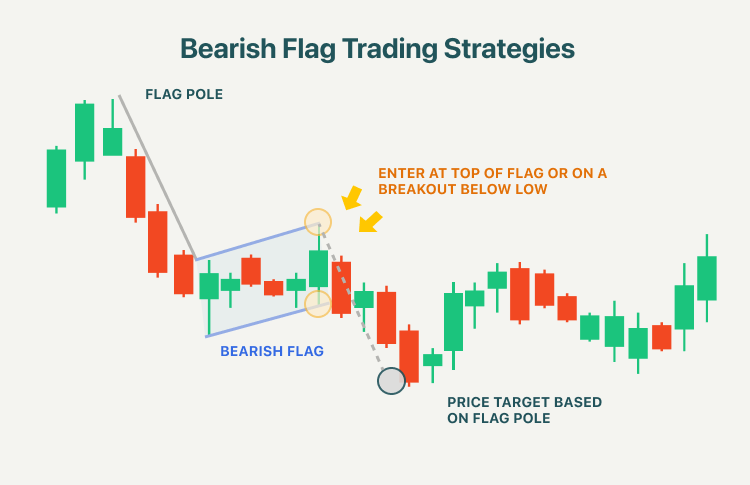
In a bearish flag pattern, traders typically expect to enter a flag after the price has closed below (short position) the lower parallel trend line. A stop-loss can be placed outside the flag on the opposite side of the breakout. Traders then look to take profits by projecting the length of the flagpole preceding the flag.
Summary:
- A flag is a short-term price pattern used to identify the possible continuation of a previous trend from a point at which the price has drifted against that same trend.
- A bullish flag is a price pattern that occurs as a brief pause in the trend following a strong price move higher. This pattern looks like a downward sloping channel denoted by two parallel trend lines against the preceding trend.
- The bearish flag signals the extension of the downtrend once the temporary pause is finished. After a strong downtrend, the price action consolidates within the two parallel trend lines in the opposite direction of the downtrend.
- To trade a bullish flag, traders typically expect to enter a flag on the day after the price has broken and closed above (long position) the upper parallel trend line. Traders then measure the distance in dollar terms between the pattern’s high and the base of the flagpole to set a profit target.
- To trade a bearish flag, traders typically expect to enter a flag on the day after the price has closed below (short position) the lower parallel trend line. Then they look to take profits by projecting the length of the flagpole preceding the flag.
