
What is an ascending triangle?
An ascending triangle is a bullish continuation pattern, and it is created by price moves that allow for a horizontal line to be drawn along the swing highs and a rising trendline to be drawn along the swing lows. The two lines form a triangle.
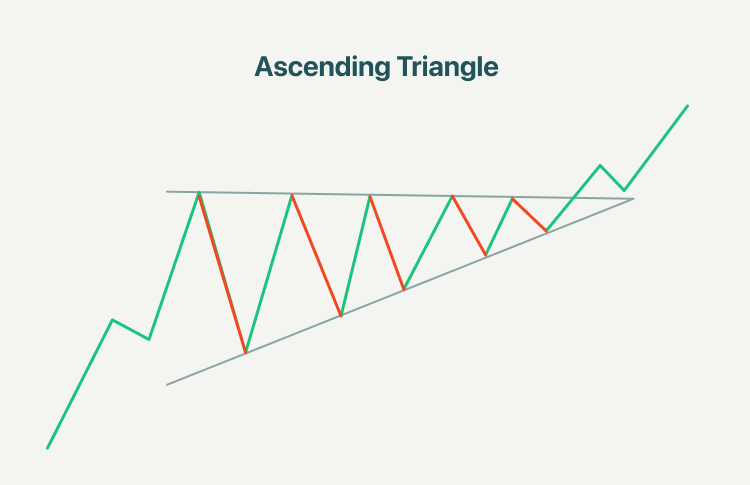
Ascending triangle pattern indicates that buyers are more aggressive than sellers as price continues to make higher lows. The pattern completes itself when price breaks out of the triangle in the direction of the overall trend. The breakout can occur on the upside or downside.
How to identify an ascending triangle pattern on price charts?
The ascending triangle is fairly easy to spot on price charts, and here are five steps that traders should look for:
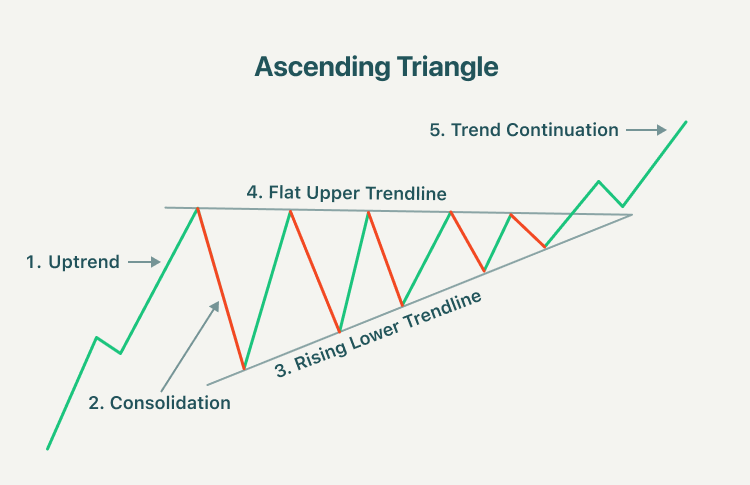
1. Uptrend
The market must be in an uptrend before the ascending triangle appears. It emphasizes that traders should not simply trade the pattern whenever the ascending triangle appears.
2. Consolidation
The ascending triangle starts to take on its form as the market enters the consolidation phase.
3. Rising lower trendline
While the market is consolidating, a rising support level can be drawn by connecting the lows. This ascending trendline shows that buyers are slowly pushing the price up, which provides further support for a bullish trading bias.
4. Flat upper trendline
The upper trendline acts as resistance. Price often approaches this level and bounces off until the breakout eventually occurs.
5. Trend continuation
After price posts a strong break above the upper trendline, traders will look for confirmation of the pattern via continued upward momentum.
What is a descending triangle?
A descending triangle is a bearish chart pattern that is created by drawing a descending upper trendline and a flat lower trendline that acts as support. It is a signal for traders to take a short position to accelerate a breakdown.
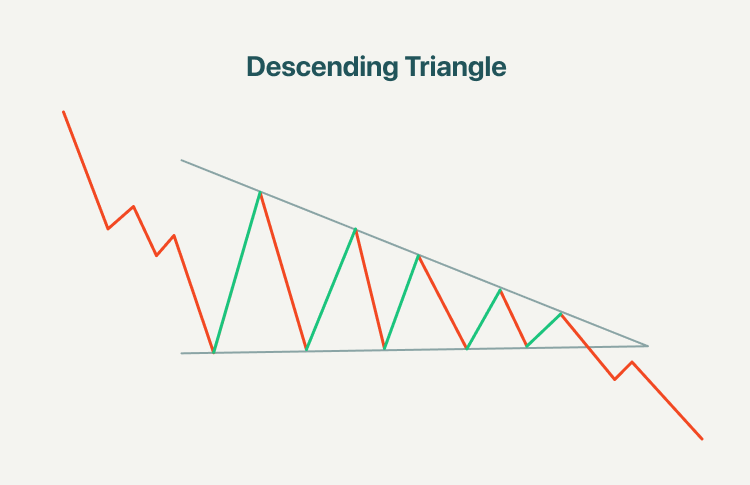
Descending triangle pattern indicates that sellers are more aggressive than buyers as price continues to make lower highs. Usually, traders watch for a move below the lower support trend line as it suggests that the downward momentum is building and a breakdown is coming. Once the breakdown occurs, traders enter into short positions and aggressively help push the price of the asset even lower.
How to identify a descending triangle chart pattern?
The below five steps can be easy to identify a descending triangle pattern:
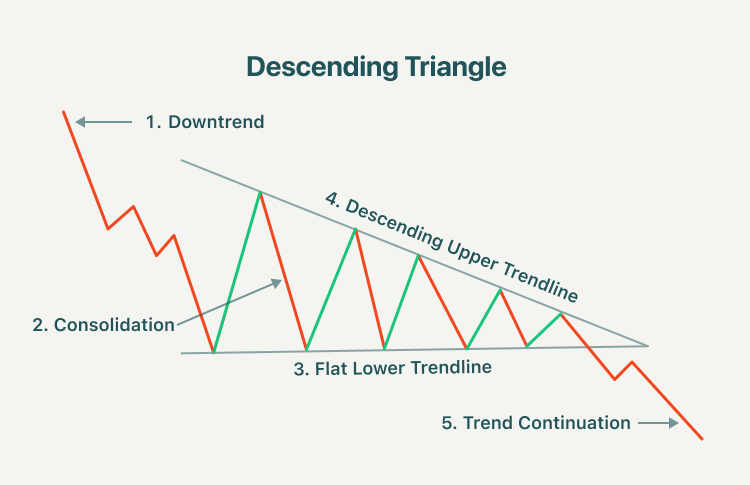
1. Downtrend
The market must be in a downtrend before the descending triangle pattern appears. It emphasizes that traders should not simply trade the pattern whenever the descending triangle appears.
2. Consolidation
The descending triangle then appears while the market enters the consolidation phase.
3. Upper trendline
While the market is consolidating, a downward sloping trendline can be drawn by connecting the highs. This downward sloping trendline shows that sellers are slowly pulling the price down, which provides further support for a bearish trading bias.
4. Lower trendline
The lower trendline acts as support. Price often approaches this level and bounces off until the breakout eventually occurs.
5. Trend continuation
After price posts a strong break below the lower trendline, traders will look for confirmation of the pattern via continued downward momentum.
How to trade ascending triangles and descending triangles?
Triangle patterns are generally categorized as a continuation pattern, meaning that after the pattern completes, it’s assumed that the price will continue in the trend direction it was moving before the pattern appeared.
1. Ascending triangles trading strategies
When trading the ascending triangle, traders need to identify the uptrend and this can be seen in the chart below.
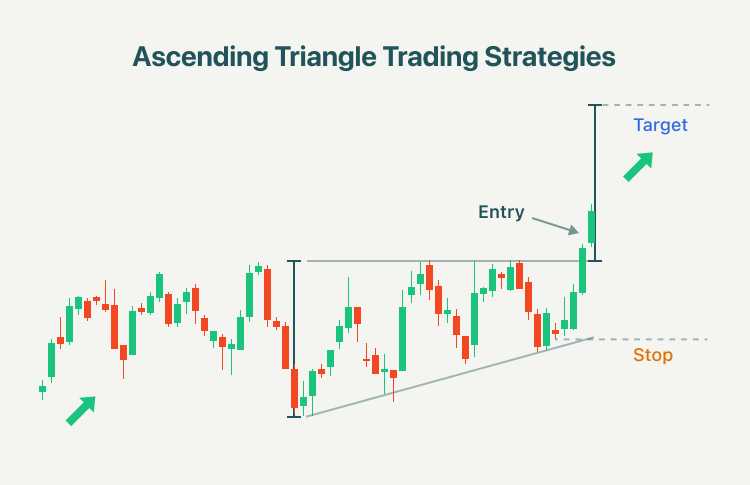
Thereafter, the ascending triangle appears as the candlesticks start to consolidate. Traders can measure the distance from the start of the pattern, at the lowest point of the rising trendline to the flat support line. That same distance can be transposed later on, starting from the breakout point and ending at the potential take profit level. This measuring technique can be applied once the triangle forms, as traders anticipate the breakout. After seeing a strong break above resistance, traders can enter a long position, setting a stop at the recent swing low and take profit targets.
2. Descending triangles trading strategies
When trading the descending triangle, traders need to identify the downtrend and this can be seen in the chart below.
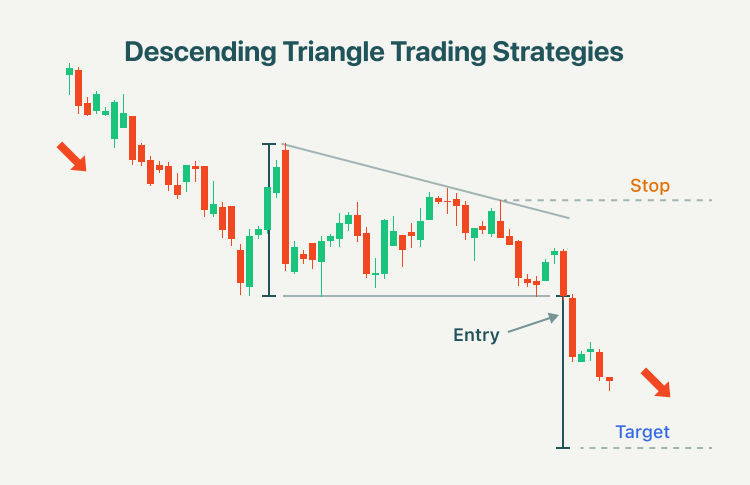
Thereafter, the descending triangle appears as the candlesticks start to consolidate. Traders can measure the distance from the start of the pattern, at the highest point of the descending triangle to the flat support line. That same distance can be transposed later on, starting from the breakout point and ending at the potential take profit level. This measuring technique can be applied once the triangle forms, as traders anticipate the breakout. After viewing a strong break below support, traders can enter a short position, setting a stop at the recent swing high and take profit target.
Summary:
- An ascending triangle is a bullish continuation pattern, and it is created by price moves that allow for a horizontal line to be drawn along the swing highs and a rising trendline to be drawn along the swing lows.
- An ascending triangle pattern indicates that buyers are more aggressive than sellers as price continues to make higher lows. The pattern completes itself when price breaks out of the triangle in the direction of the overall trend.
- A descending triangle is a bearish chart pattern that is created by drawing a descending upper trendline and a flat lower trendline that acts as support. It is a signal for traders to take a short position to accelerate a breakdown.
- In a descending triangle, traders usually watch for a move below the lower support trend line as it suggests that the downward momentum is building and a breakdown is coming.
- After seeing a strong break above resistance of the ascending triangle, traders can enter a long position, setting a stop at the recent swing low and take profit targets.
- After viewing a strong break below support of the descending triangle, traders can enter a short position, setting a stop at the recent swing high and take profit target.
