
Saudi Market
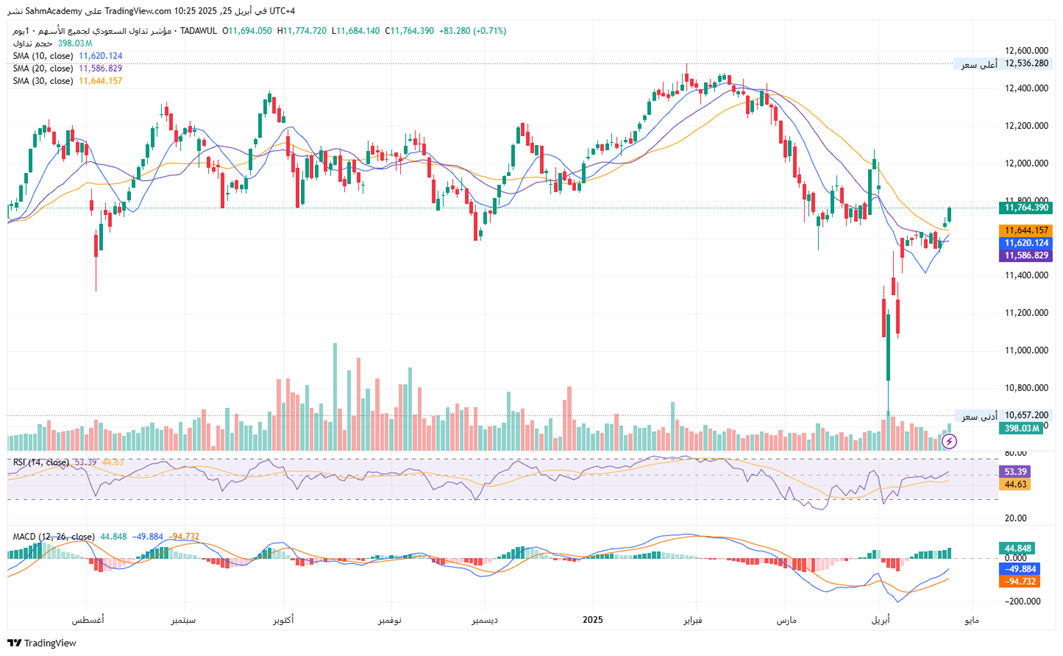
TASI Technical Analysis:
The Tadawul All Shares Index, currently at 11,764.39, is experiencing a recovery phase following a significant March correction, trading above its 10-day (11,620.12), 20-day (11,586.83), and 30-day (11,644.16) SMAs, indicating short-, medium-, and intermediate-term positive trends respectively. Immediate resistance is between 12,200-12,400, while immediate support aligns with the 20-day SMA at 11,600, stronger support at 11,400, and major support in the 10,800-11,000 zone. Momentum indicators are positive: RSI (53.39) shows a positive divergence from 44.63, and MACD (44.85) indicates a positive crossover with its histogram turning positive. The index has formed a potential double bottom around 11,000 and recently broke out of a descending channel.
TASI Index Weekly Market Summary (April 20 to April 24)
The TASI index increased by 1.19%. With a trading week of 5 days, the total trading volume reached 25 billion Saudi Riyals, averaging 5.1 billion per day.
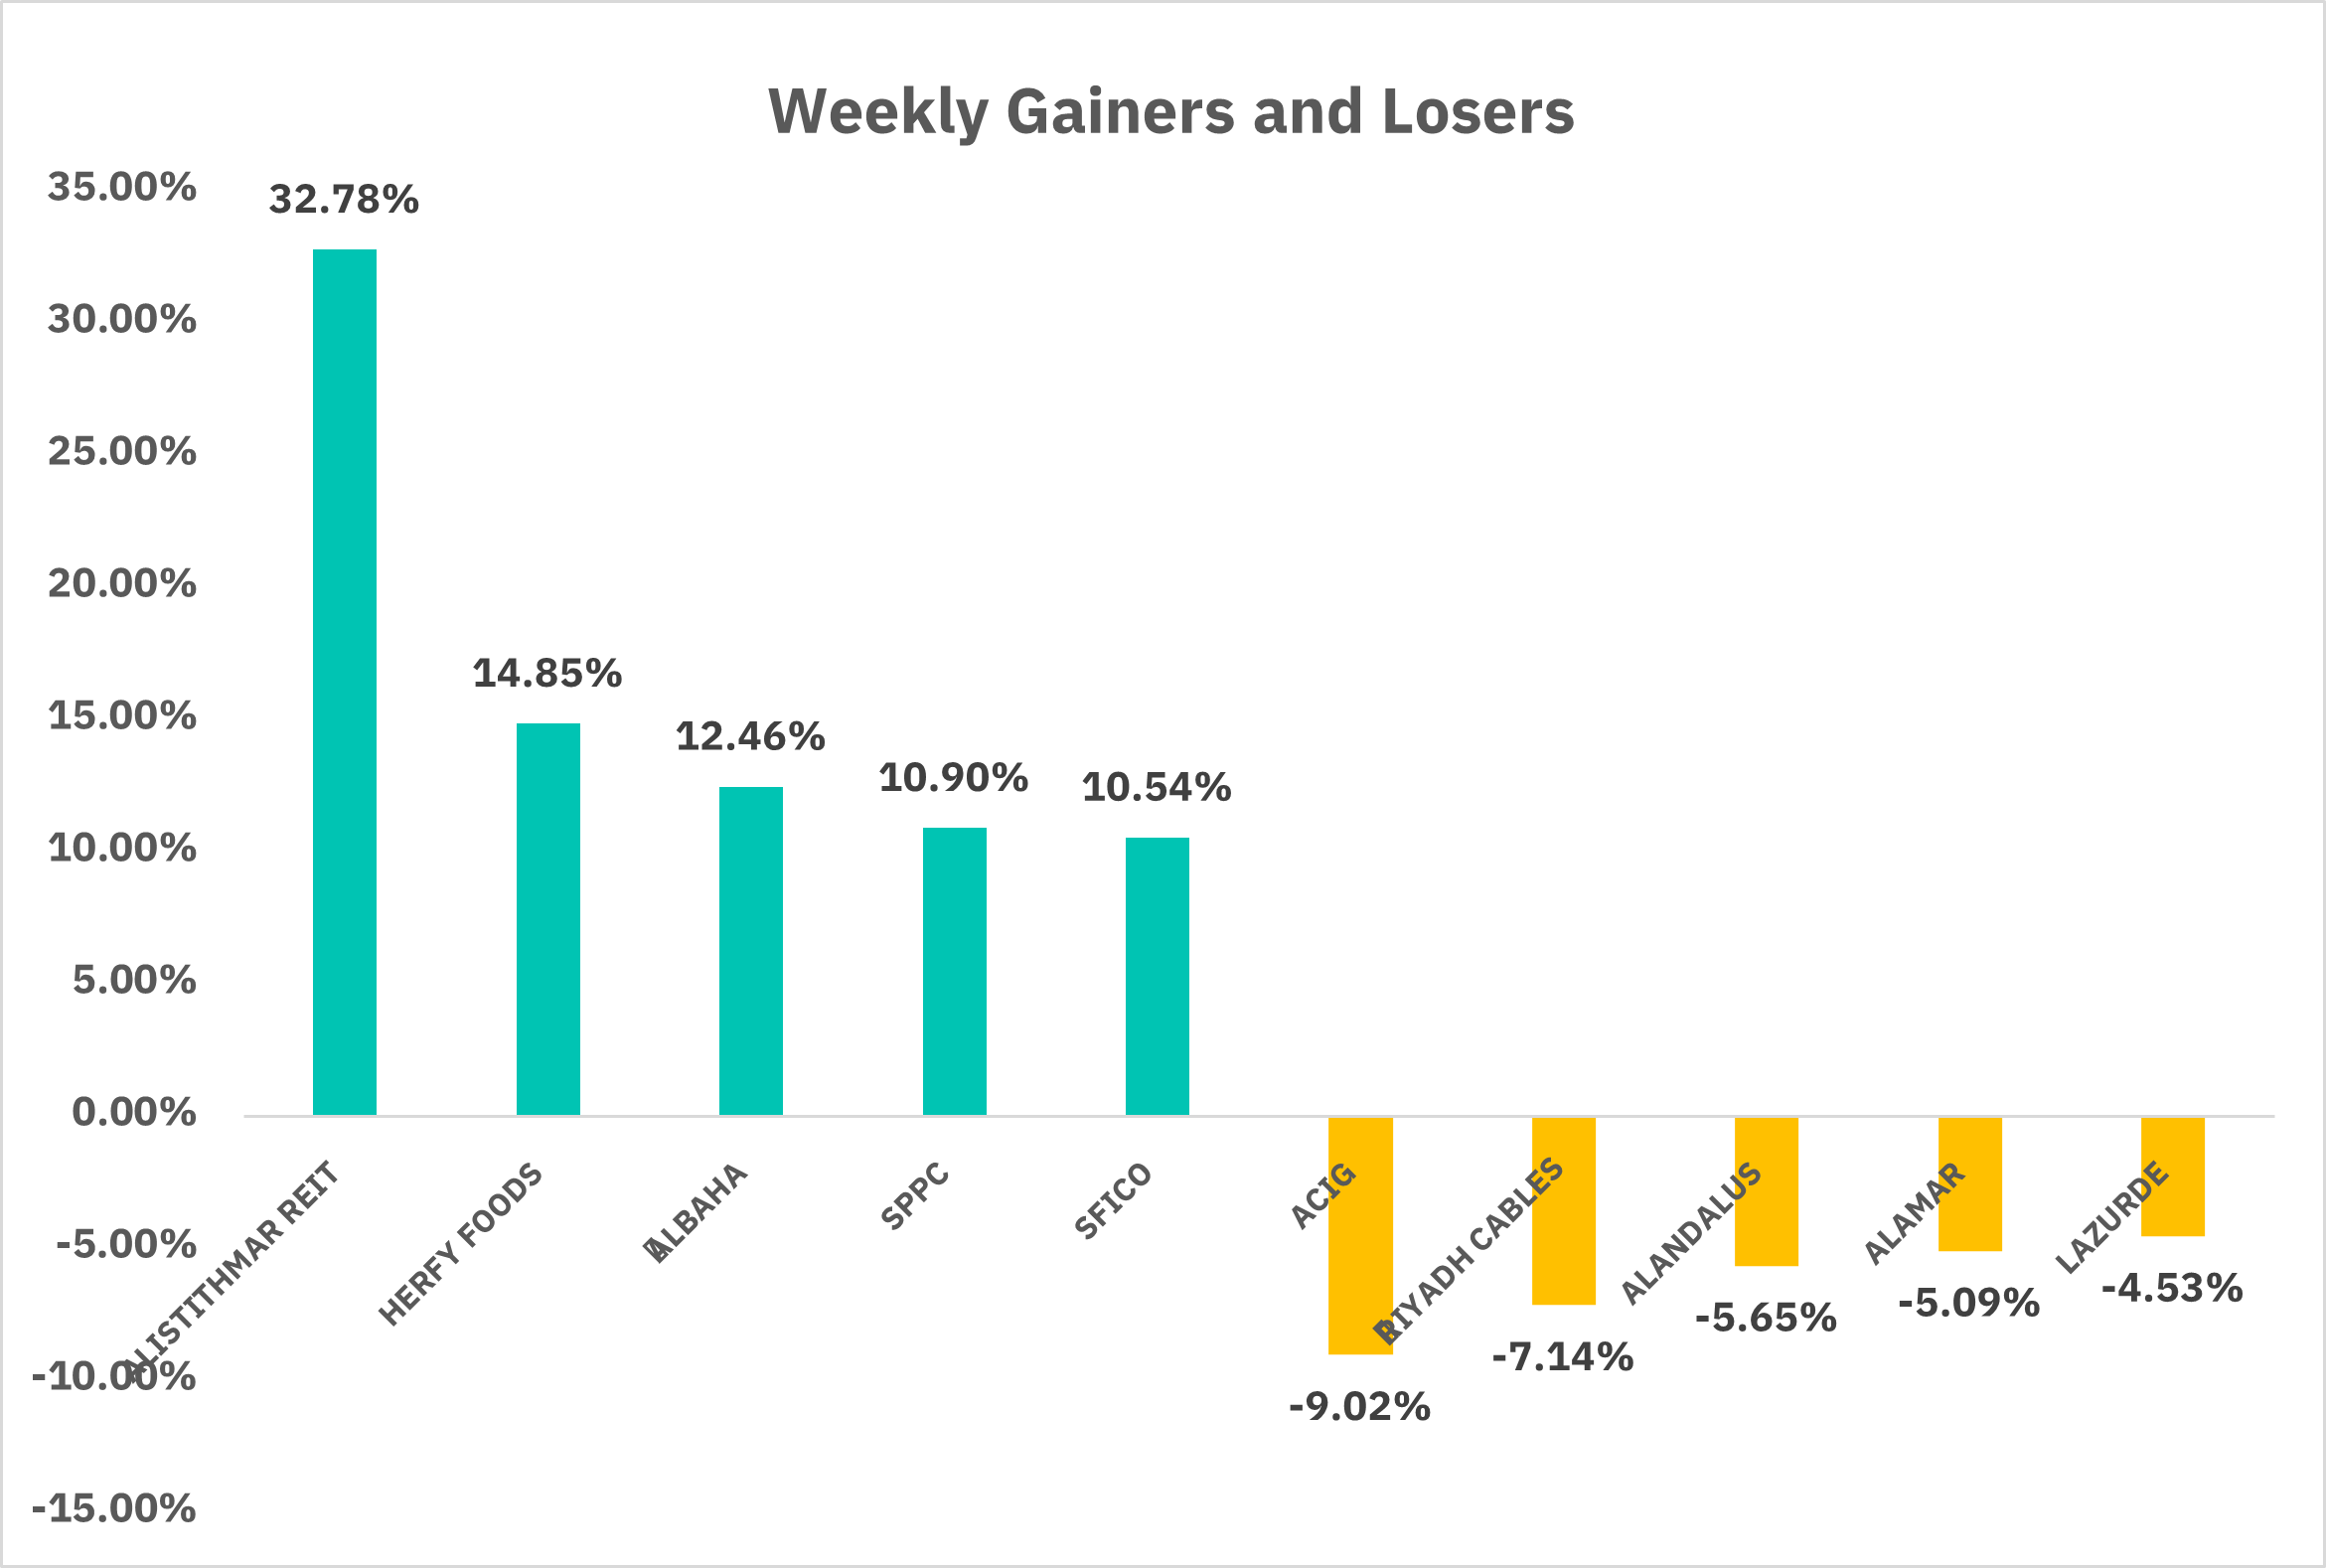
From the perspective of individual stock performance, 161 companies saw their stock prices rise this week, while 101 companies saw their stock prices fall. The companies with the highest increase included ALISTITHMAR REIT, HERFY FOODS, ALBAHA, with increases of 32.78%, 14.85%, and 12.46% respectively. The companies with the highest decline included ACIG, RIYADH CABLES, ALANDALUS, with declines of 9.02 %, 7.14 %, and 5.65 % respectively.
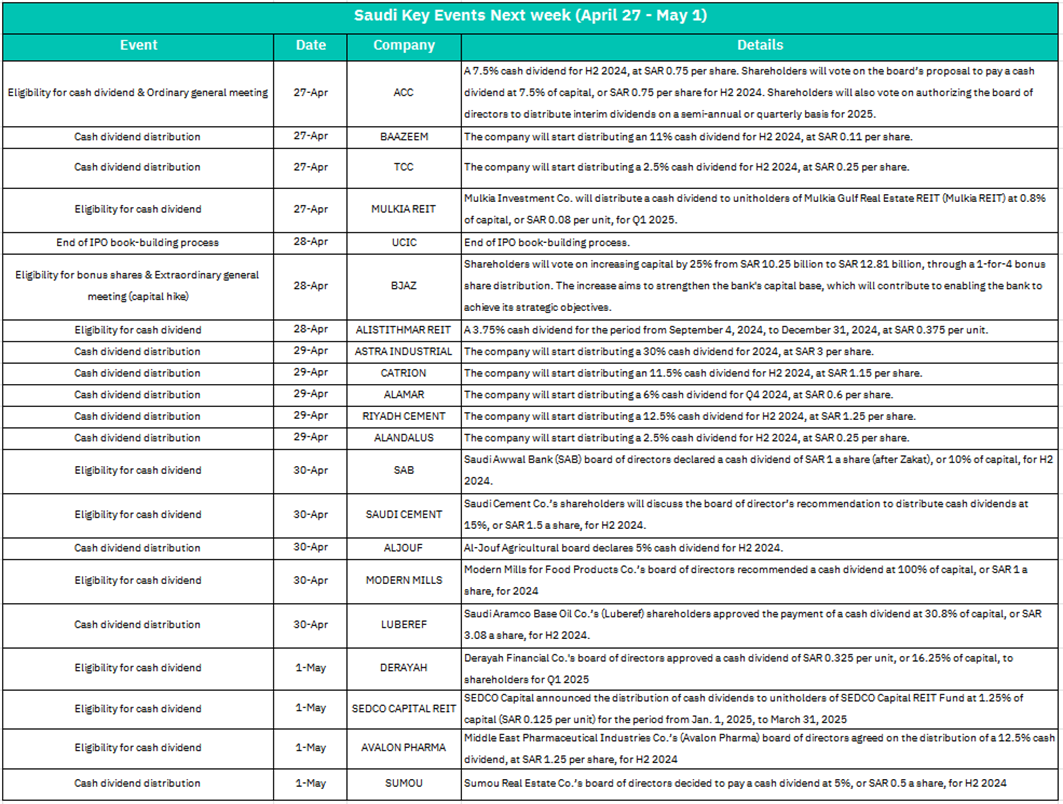
1.April 27– ACC
Eligibility for 7.5% cash dividend (SAR 0.75/share) for H2 2024 and OGM to approve interim dividends for 2025. Likely positive sentiment due to dividend clarity and flexibility for future payouts. May attract income-focused investors.
– BAAZEEM, TCC, MULKIA REIT
Start of 11% (SAR 0.11), 2.5% (SAR 0.25), and 0.8% (SAR 0.08) dividend distributions.
Short-term positive momentum for these stocks, especially BAAZEEM (higher yield). REITs may see steady demand from yield-seeking investors.
2. April 28 – UCIC
End of IPO book-building. Potential liquidity shift if oversubscribed. Success could boost sentiment for upcoming IPOs; failure may dampen market confidence.
– BJAZ
Vote on 25% capital hike (1-for-4 bonus shares).
Short-term dilution risk may pressure shares. Long-term positive if capital strengthens growth prospects.
– ALISTITHMAR REIT
Eligibility for 3.75% dividend (SAR 0.375/unit).
Neutral to mildly positive, depending on REIT sector performance.
3. April 29 –ASTRA INDUSTRIAL (30%: SAR 3/share), CATRION (11.5%), RIYADH CEMENT (12.5%)
Strong positive signals, especially for ASTRA (highest yield). Likely pre-event buying pressure.
– ALAMAR, ALANDALUS
Lower dividends (6% and 2.5%).
Limited reaction expected unless results exceed expectations.
4. April 30 – SAB, SAUDI CEMENT, ALJOUF, MODERN MILLS
Eligibility for dividends (10%, 15%, 5%, and 100% respectively).
MODERN MILLS’ 100% dividend (SAR 1/share) could trigger significant volatility. Cement sector (SAUDI CEMENT) may see sector-wide interest.
LUBEREF: 30.8% dividend (SAR 3.08/share).
Positive for energy-linked stocks; reflects strong cash flow in Aramco subsidiaries.
5. May 1 – DERAYAH, SEDCO REIT, AVALON PHARMA, SUMOU
Dividend eligibility (16.25%, 1.25%, 12.5%, 5%). AVALON PHARMA (12.5%) may outperform healthcare peers. SEDCO REIT’s low yield may limit enthusiasm.
U.S. Market
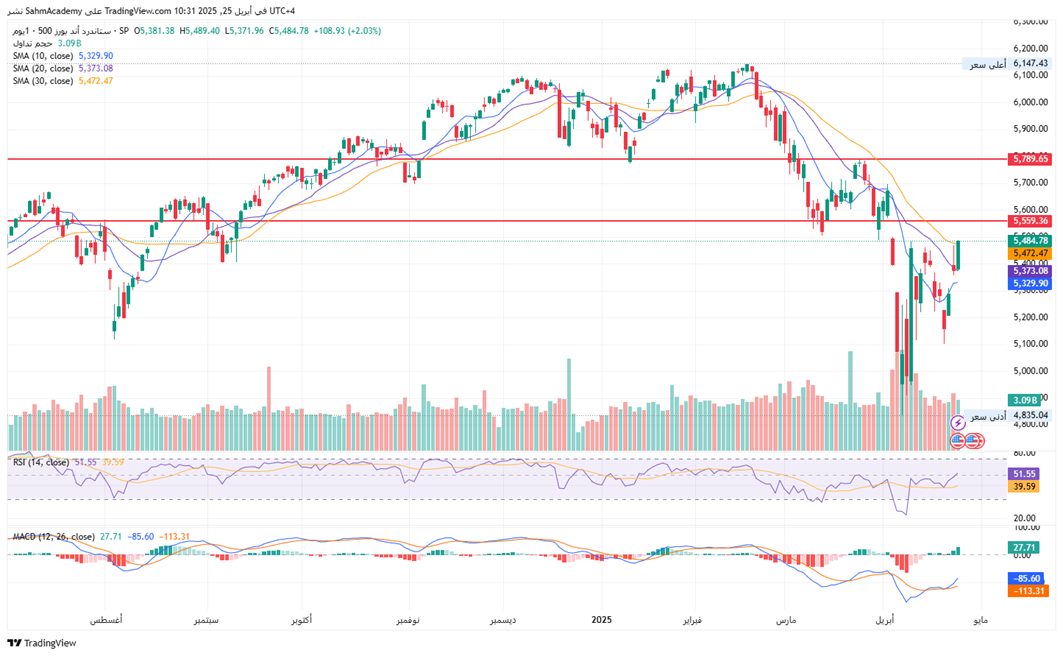
S&P500 Technical Analysis:
The S&P 500 Index, currently at 5,484.78, trading above its 10-day (5,329.90), 20-day (5,373.08), and 30-day (5,472.47) SMAs. Key resistance levels are at 5,559.36 and 5,789.65, while support levels are at 5,373.08 (20-day SMA). Momentum indicators are positive: RSI (51.55) has broken above the midline and is trending above its signal line, showing positive divergence, while MACD (27.71) indicates building positive momentum with its histogram developing a positive crossover. For the medium term (1-3 months), the outlook is cautiously positive if the index sustains above 5,500, needing to overcome 5,789.65 for confirmation of a broader uptrend resumption, with potential consolidation between 5,300-5,600. The recent price action, combined with improving momentum indicators, suggests the S&P 500 may continue its recovery rally, but the 5,559.50-5,600 zone represents significant overhead resistance that must be cleared for confirmation of a sustained uptrend resumption.
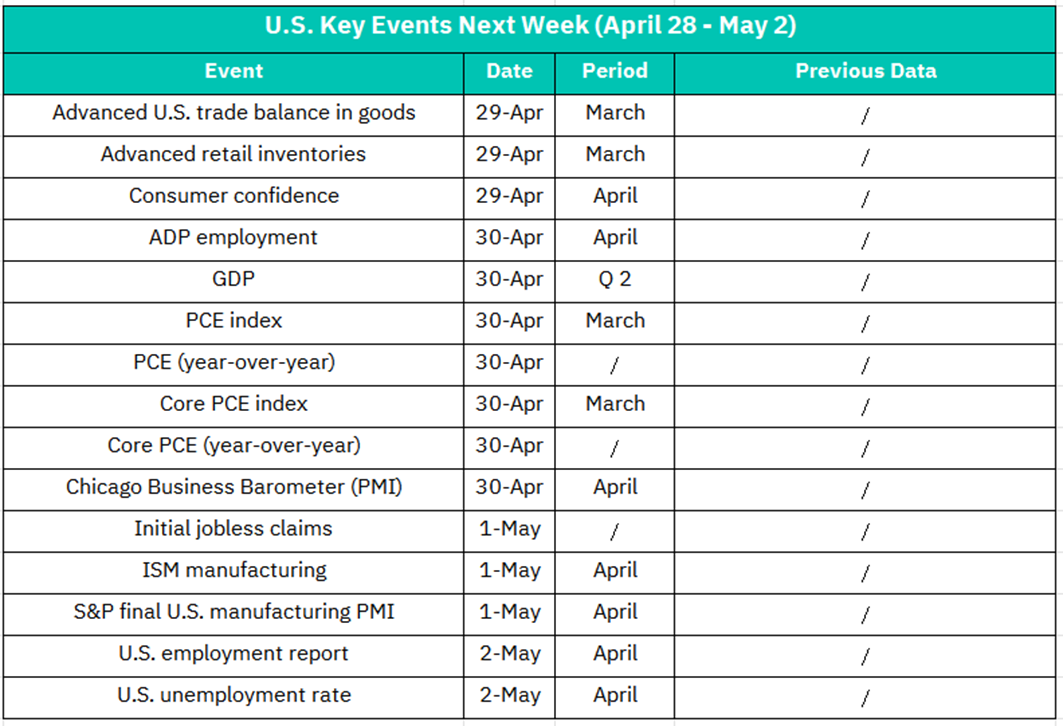
1.April 29– Advanced Trade Balance in Goods (March)
A larger-than-expected deficit could weigh on the dollar and export-linked sectors (e.g., industrials). Neutral if aligned with forecasts.
–Advanced Retail Inventories (March)
Rising inventories may signal weak demand, pressuring retail stocks. Conversely, restocking optimism could lift sentiment.
–Consumer Confidence (April)
A decline may trigger concerns about spending slowdown, hurting consumer discretionary stocks. A rebound would support risk appetite.
2. April 30 – ADP Employment (April)
Strong job growth (>200K) could boost cyclical sectors (e.g., financials, industrials). Weak data may revive recession fears.
– Q2 GDP
Upward revision (>3% annualized) would reinforce economic resilience, favoring equities. Downward revision risks a pullback.
– PCE Index & Core PCE (March)
Hotter inflation (>0.3% MoM) would heighten Fed hawkishness, pressuring tech/growth stocks. In-line data may calm markets.
– Chicago PMI (April)
A reading above 50 (expansion) supports manufacturing optimism. Sub-50 could drag industrial and material sectors.
3. May 1 – Initial Jobless Claims
Persistent claims above 220K may signal labor cooling, easing rate hike fears. Lower claims reinforce labor strength.
– ISM Manufacturing PMI (April)
A rebound above 50 could lift industrials. Continued contraction (<48) risks broader market sell-off.
– S&P U.S. Manufacturing PMI (Final)
Confirmation of expansion (>50) aligns with ISM optimism; divergence may cause confusion.
4. May 2– Nonfarm Payrolls & Unemployment Rate (April)
Jobs >250K + Unemployment <3.8%: Mixed reaction—positive for cyclicals but bearish for bonds/tech due to Fed fears.
Jobs <180K + Unemployment >4%: Raises stagflation risks, likely triggering broad volatility.
Crypto ETF Technical Analysis:
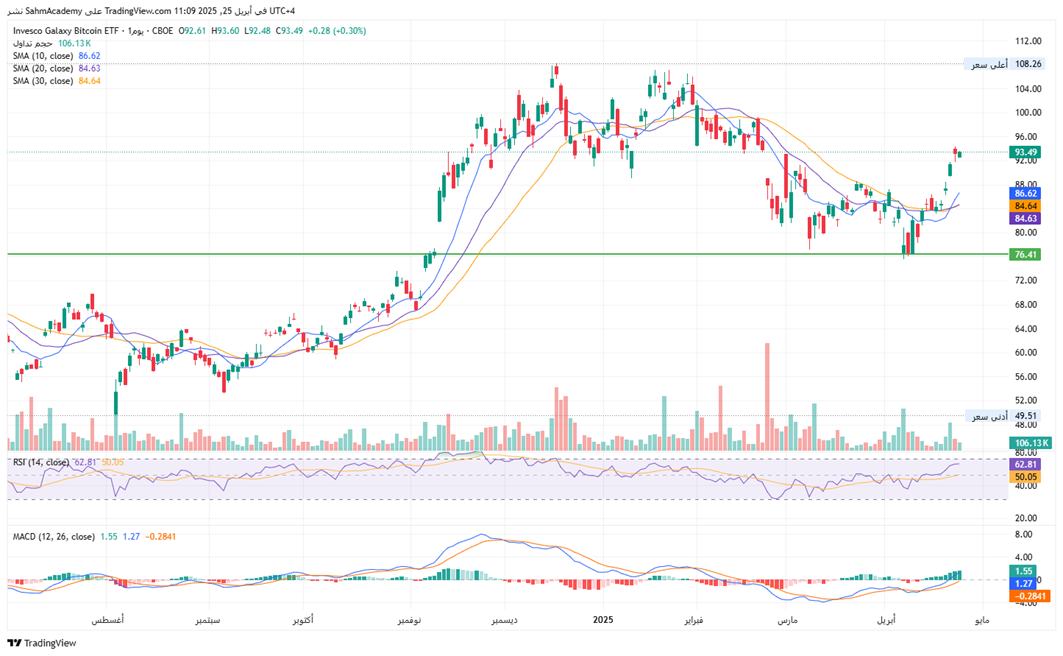
The Invesco Galaxy Bitcoin ETF (BTCO), currently priced at $93.49, is in a strong recovery phase after testing critical support at $76.41. The ETF has formed higher lows and higher highs since the April bottom and has recently broken above all key SMAs, signaling a potential trend reversal. With the price above the 10-day ($86.62), 20-day ($84.63), and 30-day ($84.64) SMAs, the moving averages are beginning to curl upward from a previous bearish alignment. Major resistance is in the $96-100 zone. Current support is at the 10-day SMA ($86.62), with strong support at the 20-day and 30-day SMA cluster ($84.63-$84.64) and critical support at $76.41. The RSI (14) at 62.81 shows positive momentum above the 50 mark and is trending above its signal line (50.05). The MACD at 1.55 is positive and above its signal line (1.27), with the histogram showing positive divergence. Technical patterns include a completed inverse head and shoulders pattern with a neckline around $86-87, a successful breakout above the downtrend line from February highs, and a forming golden cross.
Disclaimer:
Sahm is subject to the supervision and control of the CMA, pursuant to its license no. 22251-25 issued by CMA.
The Information presented above is for information purposes only, which shall not be intended as and does not constitute an offer to sell or solicitation for an offer to buy any securities or financial instrument or any advice or recommendation with respect to such securities or other financial instruments or investments. When making a decision about your investments, you should seek the advice of a professional financial adviser and carefully consider whether such investments are suitable for you in light of your own experience, financial position and investment objectives. The firm and its analysts do not have any material interests or conflicts of interest in any companies mentioned in this report.
Performance data provided is accurate and sourced from reliable platforms, including Argaam, TradingView, MarketWatch.
IN NO EVENT SHALL SAHM CAPITAL FINANCIAL COMPANY BE LIABLE FOR ANY DAMAGES, LOSSES OR LIABILITIES INCLUDING WITHOUT LIMITATION, DIRECT OR INDIRECT, SPECIAL, INCIDENTAL, CONSEQUENTIAL DAMAGES, LOSSES OR LIABILITIES, IN CONNECTION WITH YOUR RELIANCE ON OR USE OR INABILITY TO USE THE INFORMATION PRESENTED ABOVE, EVEN IF YOU ADVISE US OF THE POSSIBILITY OF SUCH DAMAGES, LOSSES OR EXPENSES.
